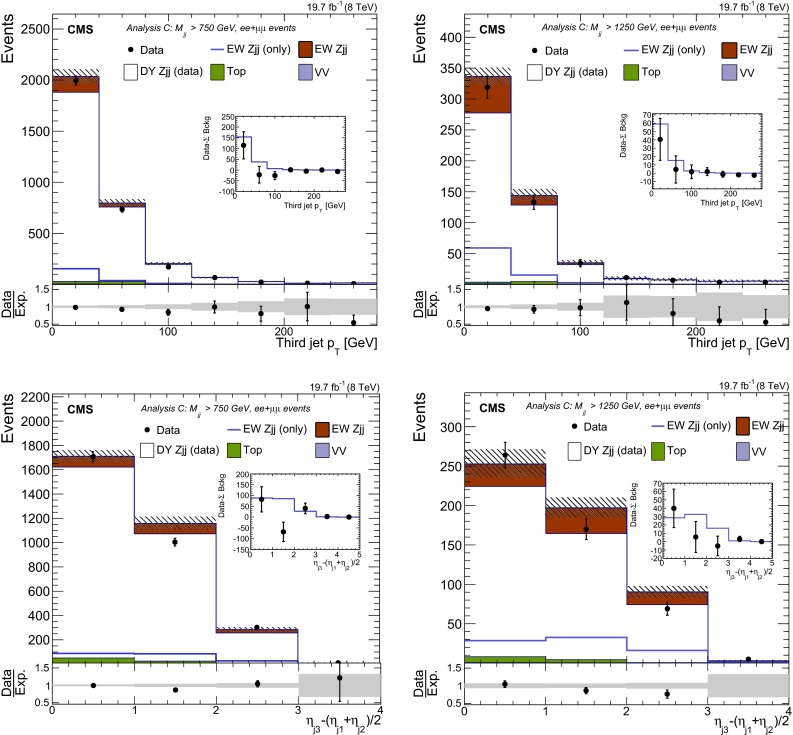
Fig. 15.

(Top row) and (bottom row) of the leading additional jet within the of the two tagging jets in events with (left column) or (right column). The explanation of the plots is similar to Fig. 14

(Top row) and (bottom row) of the leading additional jet within the of the two tagging jets in events with (left column) or (right column). The explanation of the plots is similar to Fig. 14