Figure 1.

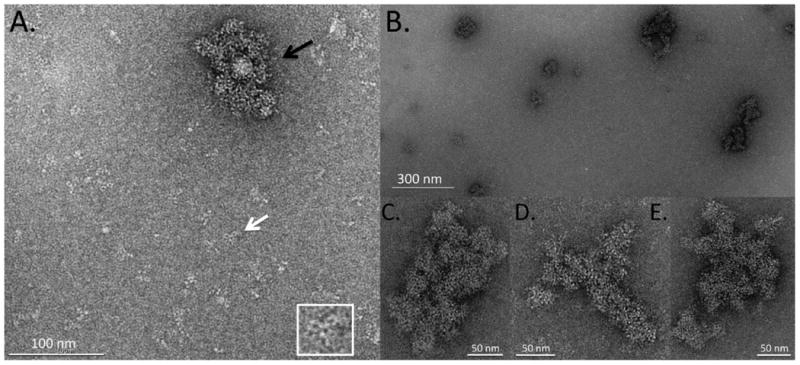
TEM images of negatively stained, stressed IVIg. (A) Representative image showing sub-micron IVIg aggregate (black arrow) surrounded by small oligomeric antibody complexes and monomeric IVIg molecules. A view of the monomeric IVIg molecule identified by the white arrow is shown at increased scale in the lower right corner. This antibody is oriented in a planar fashion on the grid, giving it a Y-shaped appearance. The three arms of the molecule are visible in the form of small rings. (B) Field of view at lower magnification showing distribution and size range of IVIg aggregates. (C to E) Individual IVIg aggregates at high magnification. The aggregates are compact and appear to be formed from smaller globules.
