
Figure 3. NRBF2 regulates autophagy induction.
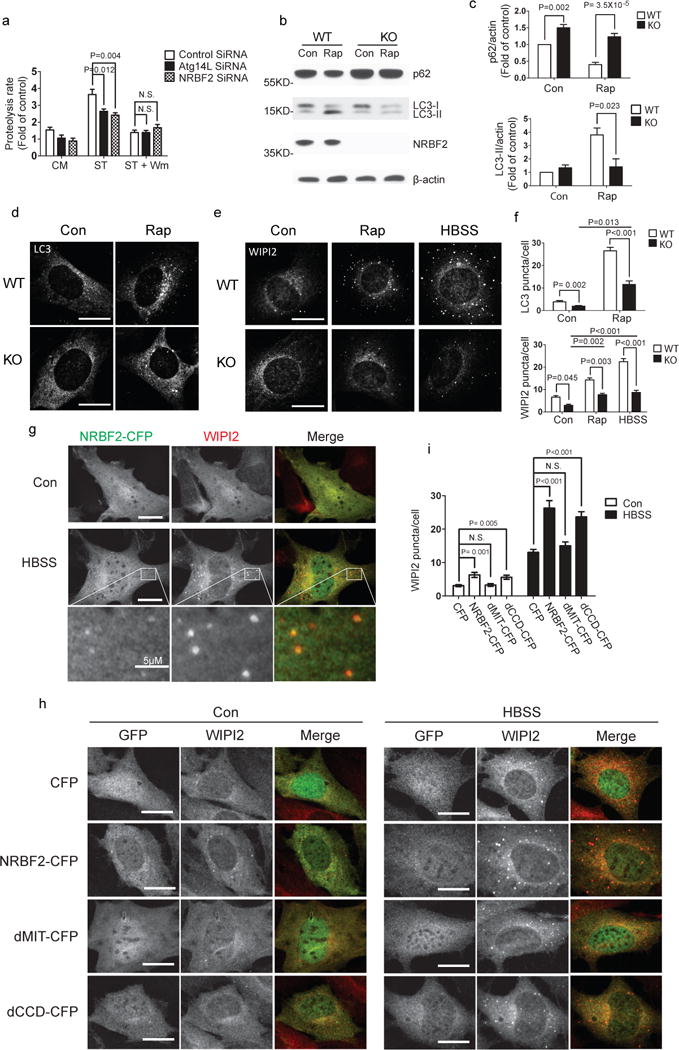
(a) Starvation-induced long-lived protein degradation is impaired after NRBF2 knockdown. Compared with control siRNA, NRBF2 siRNA decreases long-lived protein degradation (proteolysis rate) in NIH3T3 cells under starvation (ST) condition. This difference is diminished when the starved cells are co-treated with wortmannin (WM, 100 nM). (Data shown as mean±SEM, P values are indicated on the figures, one-way ANOVA with Dunnett as Post Hoc test, n=4). (b) Rapamycin-induced autophagy is impaired in the NRBF2 KO cells. The MEFs were treated with DMSO or 50 μg/ml of rapamycin for 4 hours then the cell lysates were immuno-probed with anti-LC3 and anti-p62 antibodies. (c) LC3-II and p62 levels were quantified and normalized with β-actin. Quantification results show that rapamycin-induced LC3 lipidation (upper) and p62 degradation (lower) were dramatically impaired in the NRBF2 KO MEFs (Data shown as mean±SEM, P values are indicated on the figures, one sample t test (WT con versus KO con) or unpaired t test (WT Rap versus KO Rap). p62 blots quantification, n=6; LC3 blots quantification, n=3). (d, e) The MEFs were subjected to rapamycin (50 μg/ml) or starvation (HBSS) treatment then stained with anti-LC3 (d) or anti-WIPI2 (e) antibody. (f)The LC3 and WIPI2 puncta per cell were counted and quantified (Data shown as mean±SEM, P values are indicated on the figures, independent samples kruskal-wallis test followed by pairwise comparisons, n=30 randomly selected cells, a representative result from 3 independent repeats). (g) NRBF2-CFP stable cells were starved in HBSS for 4 hours and then subjected to WIPI2 staining. Under starved condition, NRBF2-CFP forms puncta structures which co-localized with WIPI2. This is a representative image from 3 independent experiments. (h) The NRBF2 KO MEFs were transfected with CFP, NRBF2-CFP, dMIT-CFP or dCCD-CFP for 24 hours and then followed by co-immunostaining with GFP and WIPI2 antibodies. (i) The WIPI2 puncta number per cell in GFP positive cells were counted and quantified. (Data shown as mean±SEM, P values are indicated on the figures, independent samples kruskal-wallis test followed by pairwise comparisons, n=30 randomly selected cells, a representative result from 2 independent repeats). Scale bar, 20μm, or length indicated on the figure.