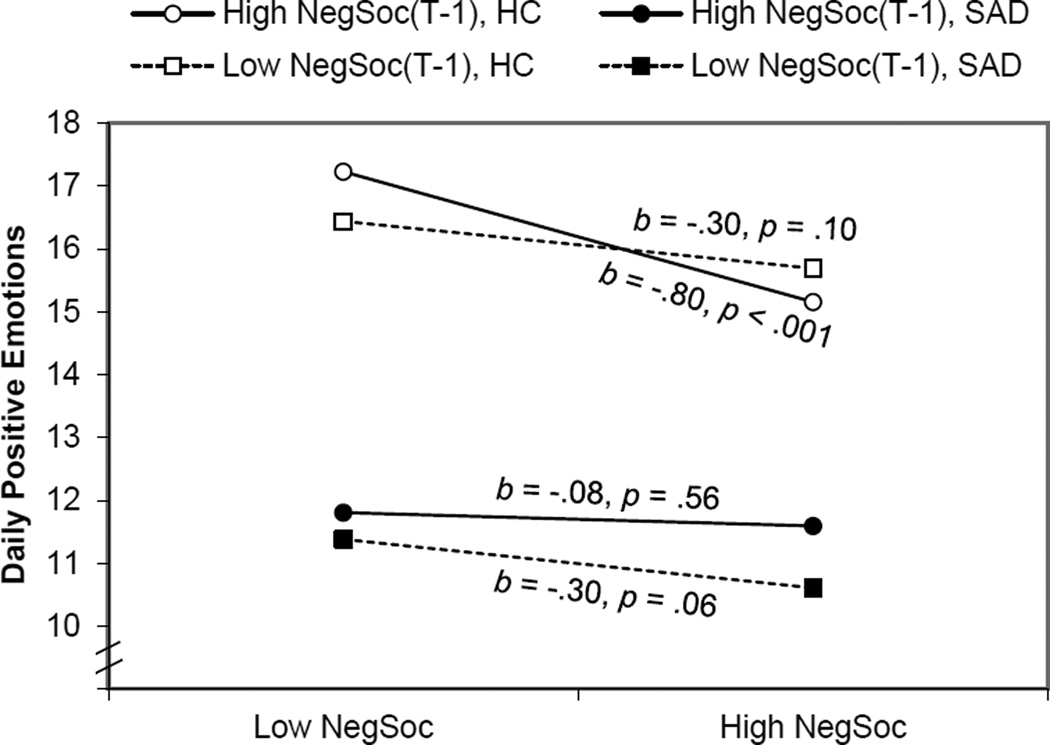
Figure 3.
Three-way Interaction Between Diagnosis, Concurrent Negative Social Events, and Lagged Negative Social Events on Positive Emotions
Notes. Simple slopes for diagnostic groups were plotted −1 SD (low) and +1 SD (high) of same-day negative social events with separate lines for low and high prior day negative social events. HC = healthy controls; NegSoc = negative social events; SAD = social anxiety disorder.

