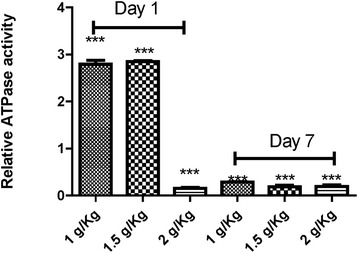
Figure 2.

Relative ATPase activity in submitochondrial particles from rats subjected to the indicated treatments. Relative ATPase activity, as fold induction, was calculated by normalization of values to their respective controls (13.5 ± 1.43 nmol min−1 (mg protein−1). Control value was fixed at 1.0. The bar indicates the mean ± S.E. ***indicate a significant difference from the control group (P < 0.001).
