Figure 1.

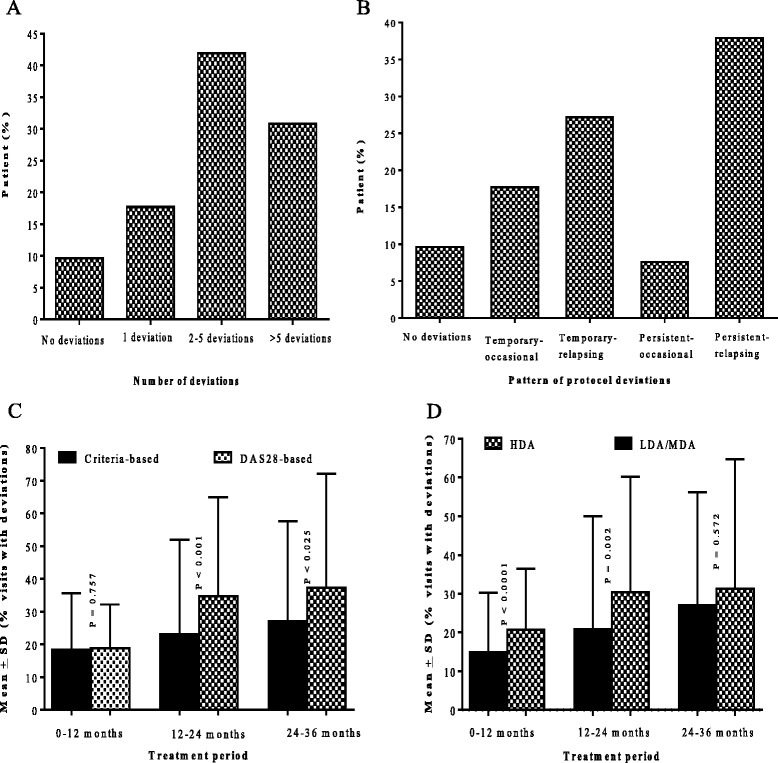
Number and pattern of deviations and deviations according to dose modification criteria (DMC) and baseline disease activity. Percentage of patients versus number of deviations encountered (A) and pattern of deviations experienced (B). Mean (SD) percentage of visits with deviation per patient in each year of treatment (C) by criteria used to inform dose modification and (D) by baseline disease activity. LDA, low disease-activity; MDA, moderate disease-activity; DAS28, disease activity score in 28 joints.
