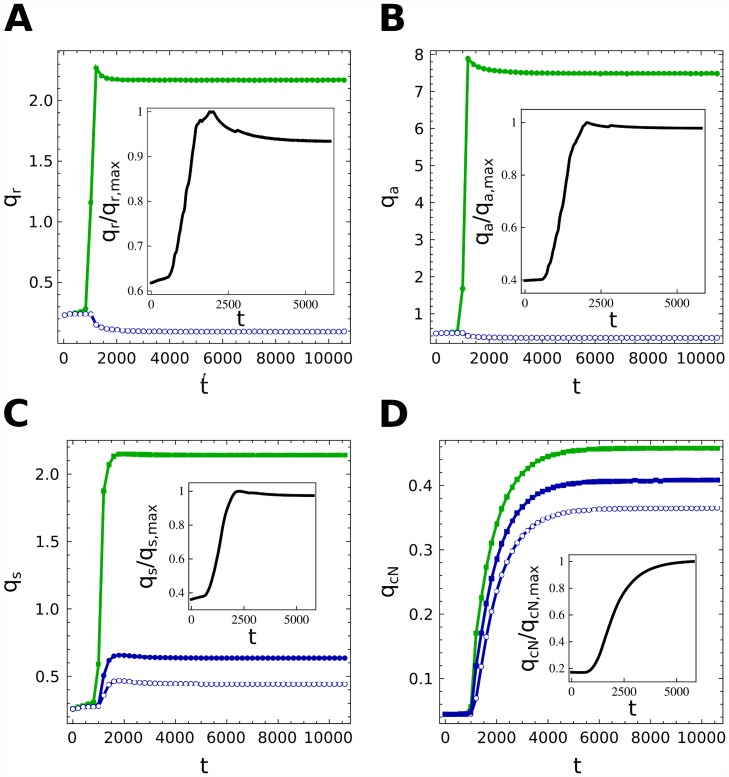
Fig 6. Time evolution of molecular concentrations.
Time evolution of the main components of the differentiation in heterocysts (green) and vegetative cells (blue). Averages along the filament are also presented (black). Heterocysts, due to the early diffusion, evolve toward steady states of the type D of Fig. 5 characterized by high levels of HetR and NtcA while vegetative cells present very low concentrations of them (A and B). The levels of PatS and cN in vegetative cells depend on their distance to close heterocysts: C and D show the concentrations of PatS and cN in a heterocyst and in its first two neighbouring vegetative cells, which clearly highlight the effect of diffusion along the filament.

