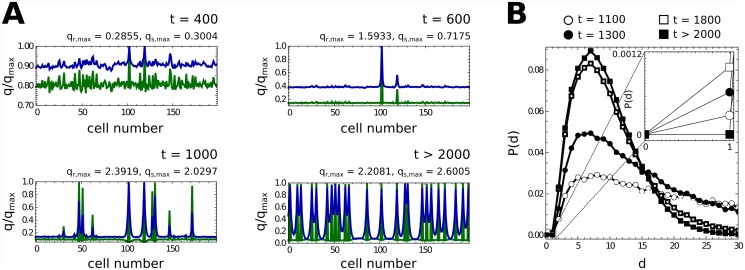
Fig 7. Heterocyst pattern.
Time-evolution of the pattern of heterocysts (A) and of the probability distribution of the distance between consecutive heterocysts (B). Green and blue curves represent the concentration profiles of HetR and PatS (NtcA and cN are not presented since their behavior along the filament is comparable to that of HetR and PatS, see Fig. 6 to see the similarities). Small perturbations along the filament of vegetative cells (initially in the steady state B of Fig. 5) are amplified due to diffusion processes in a demonstration of Turing’s theory [51]. New heterocysts appear in regions that are not dominated by the action of other heterocysts. Finally, the competition between nearby differentiating cells ceases the differentiation of some of them, as observed in B: consecutive heterocysts, which are created by strong perturbations, finally disapear due to the aforementioned competition. The final pattern presents localized levels of HetR (heterocysts) and a diffusive-like behavior of PatS, as expected.

