
Fig 3. Outside and dunghill temperatures during the experiment.
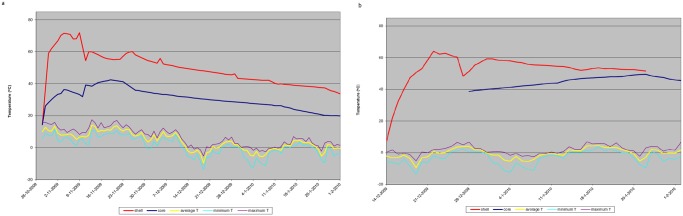
In Fig 3a, temperatures in the core (dark blue) and shell (red) of the dunghill on farm A are presented. In Fig 3b, temperatures in the core (dark blue) and shell (red) of the dunghill on farm B are presented. For both farms, the average (yellow), the minimum (turquoise) and the maximum (purple) outside air temperature in Eindhoven, the Netherlands (www.knmi.nl) during the experiments are shown. All temperatures are in degree Celsius.