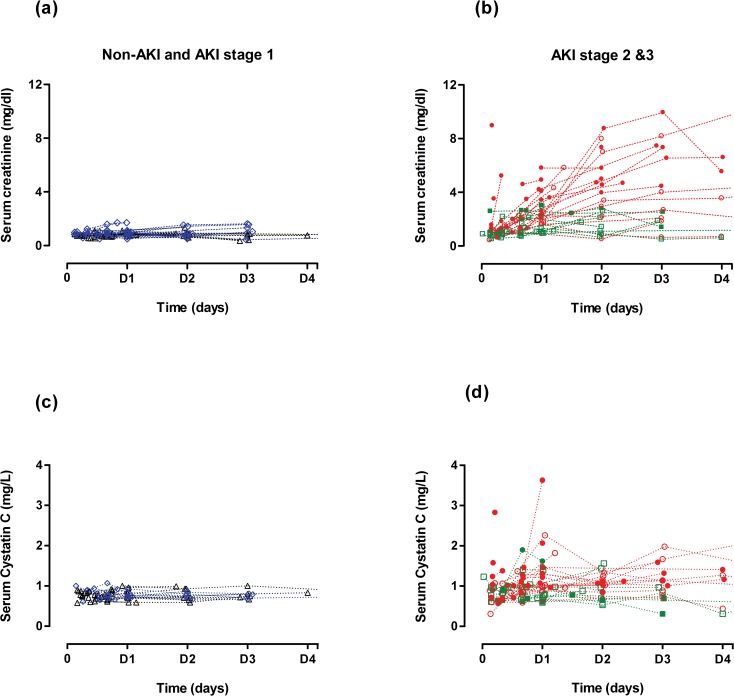
Fig 2. Serial serum concentrations of creatinine and cystatin C relative to AKI and hospital discharge status.
This figure represents the changes in absolute creatinine (a & b) and cystatin C (c & d) concentrations in each patients over 4 days following paraquat ingestion. Filled symbols represent patients who died in the hospital and the open symbols represent survivors. Patients were also grouped according to AKI severity; No-AKI (black triangle), AKIN1 (blue rhombus), AKIN2 (green square) and AKIN3 (red circles).

