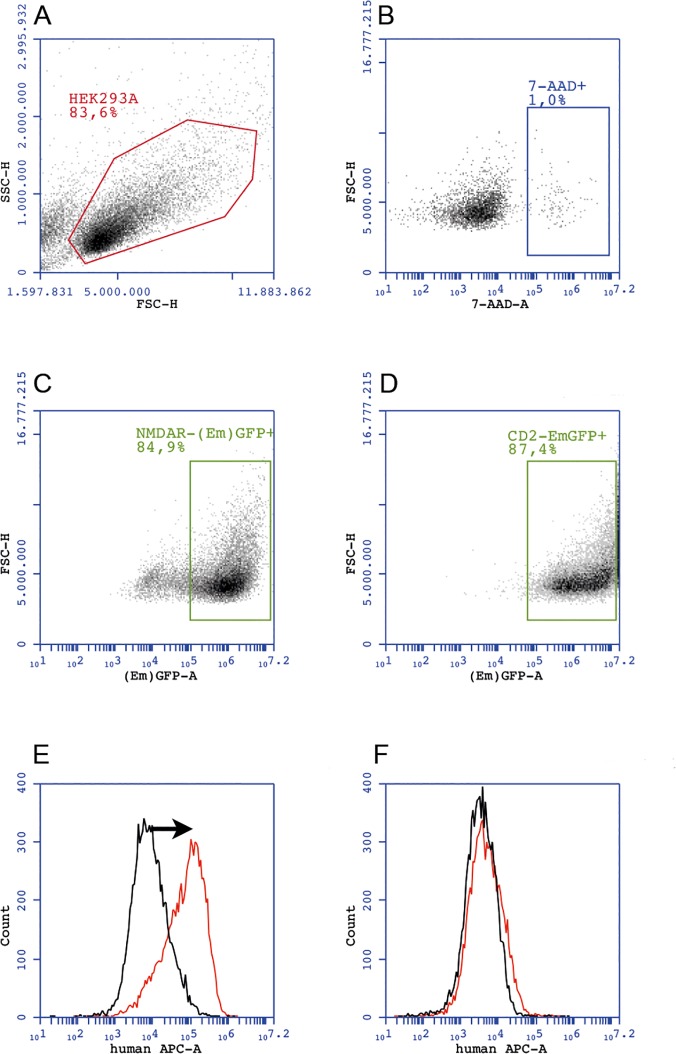
Fig 3. Gating and analysis strategy for NMDAR and CD2 expressing HEK293A cells for FACS based analysis.
(A) Gating of the HEK293A main cell population. (B) Exclusion of 7-AADpos cells. (C)+(D) Gating of (Em)GFPpos7-AADneg NMDAR and CD2 expressing cells, respectively. The green (“(Em)GFP-A”) channel detects both, EmGFP and GFP-tagged proteins. Binding of patient‘s antibodies to NMDAR results in a difference (arrow) of the APC signal obtained with NMDAR-transfected cells (red line) when compared to the APC signal of CD2-transfected cells (black line), which results in ΔMFI (E). This difference is absent in the serum of a healthy control (F). 7-AAD-A = 7-amino-actinomycin D (area). APC-A = allophycocyanin (area). (Em)GFP-A = (emerald) green fluorescent protein (area). ΔMFI = delta median fluorescence intensity. FACS = fluorescence activated cell sorting. FSC-H = forward scatter (height). NMDAR = N-methyl-D-aspartate receptor. SSC-H = side scatter (height).

