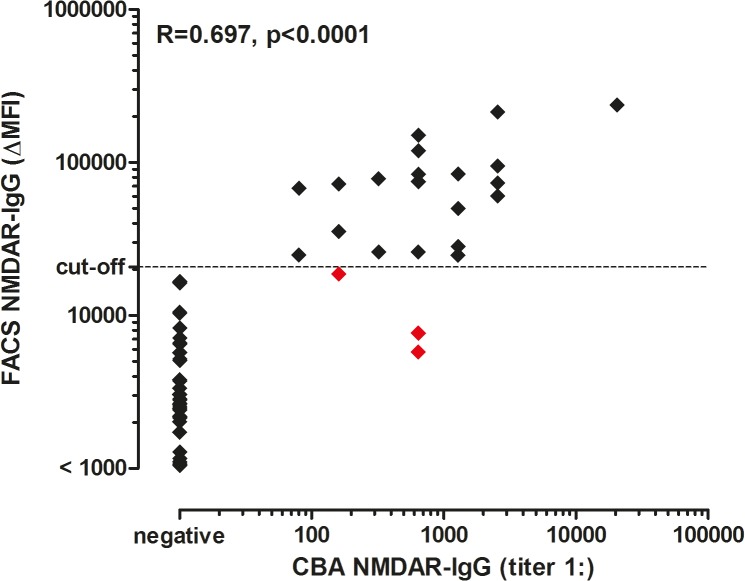
Fig 5. Correlation of NMDAR IgG titers and ΔMFI values determined by CBA and FACS assays.
The cut-off value (20,700 ΔMFI, determined by the FACS assay) is indicated by the dashed horizontal line. Correlation of antibody titers and ΔMFI values were calculated using non-parametric Spearman correlation. Correlation coefficient (R) and the p-value are shown in the graph. False negative samples in the FACS assay are depicted in red. In total, 49 samples had a ΔMFI value <1,000, which were all negative in the CBA. CBA = cell-based assay. ΔMFI = delta median fluorescence intensity. FACS = fluorescence activated cell sorting. NMDAR = N-methyl-D-aspartate receptor.

