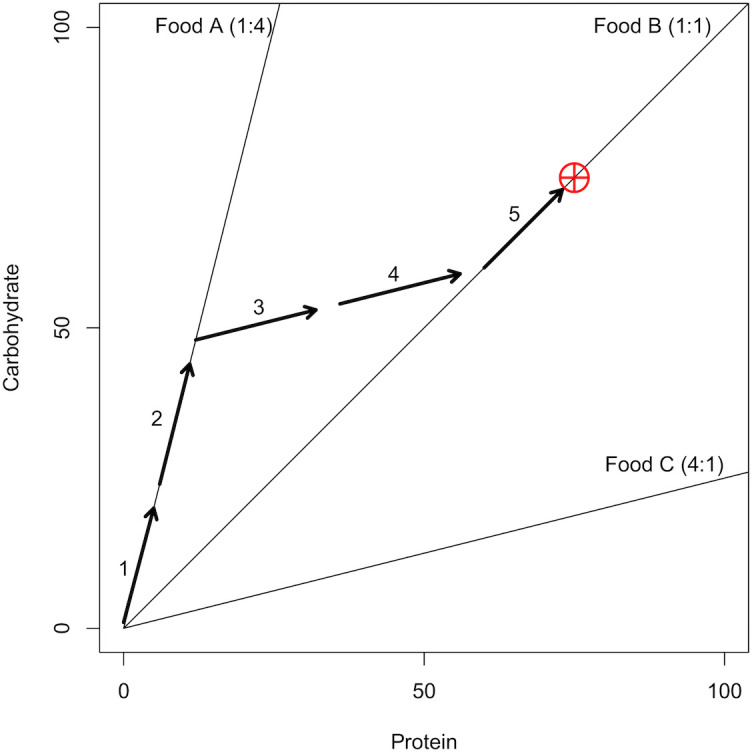
Fig 1. An Example of the Geometric Framework (GF).

A visualisation of the GF [23] used to track the nutritional state of a hypothetical individual. The graph area depicts the nutrient space available with two macronutrients; protein (P) is represented on the x-axis and carbohydrate (C) on the y-axis. The requirements of the individual with regards the two macronutrients are depicted by the Intake Target (IT; the red crosshair). In this instance the requirements for P and C are equal (75:75). An individual’s nutritional state is its (x, y) position in the nutrient space. The only way for an individual to move through the nutrient space to the IT is to eat foods. Three foods with differing P:C ratios are depicted by three food rails (solid black lines); Food A is high in C but low in P (P:C, 1:4); Food B is balanced (1:1); Food C is high in P but low in C (4:1). As an individual eats, its nutritional state moves through the nutrient space (depicted by the sequence of arrows) in parallel to the food rail for the food it is eating. Here, the individual has reached the IT by first eating Food A for steps one and two, then Food C for steps three and four, and finally on Food B for the step five. The individual could also have taken a more direct route to the IT by eating only Food B. This food is nutritionally balanced in regard to the individual’s IT. Alternatively, the individual may have eaten equal amounts of macronutrient from Foods C and A. These two foods are individually imbalanced but collectively complementary.
