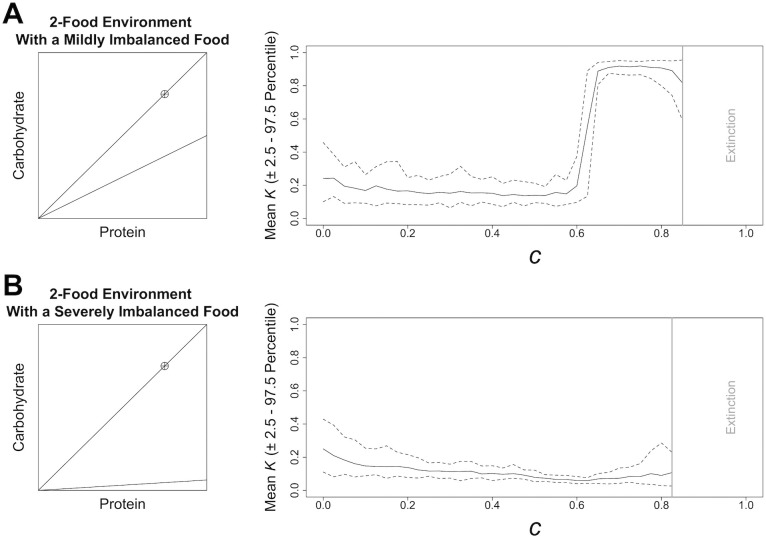
Fig 3. Model Results in Different 2-Food Environments.
The effects of increasing competition, c (Equation 3), on the mean level of nutritional latitude, K, (and the 2.5th and 97.5th percentile; dashed line) that is stable under differing nutritional environments containing 2 foods. Data are based on 30 model runs. Data from levels of competition, above which the population could not consistently survive (i.e., extinction, given by a bold grey line), have been removed. A geometric visualisation of each environment is given; see Fig. 2 legend for details.

