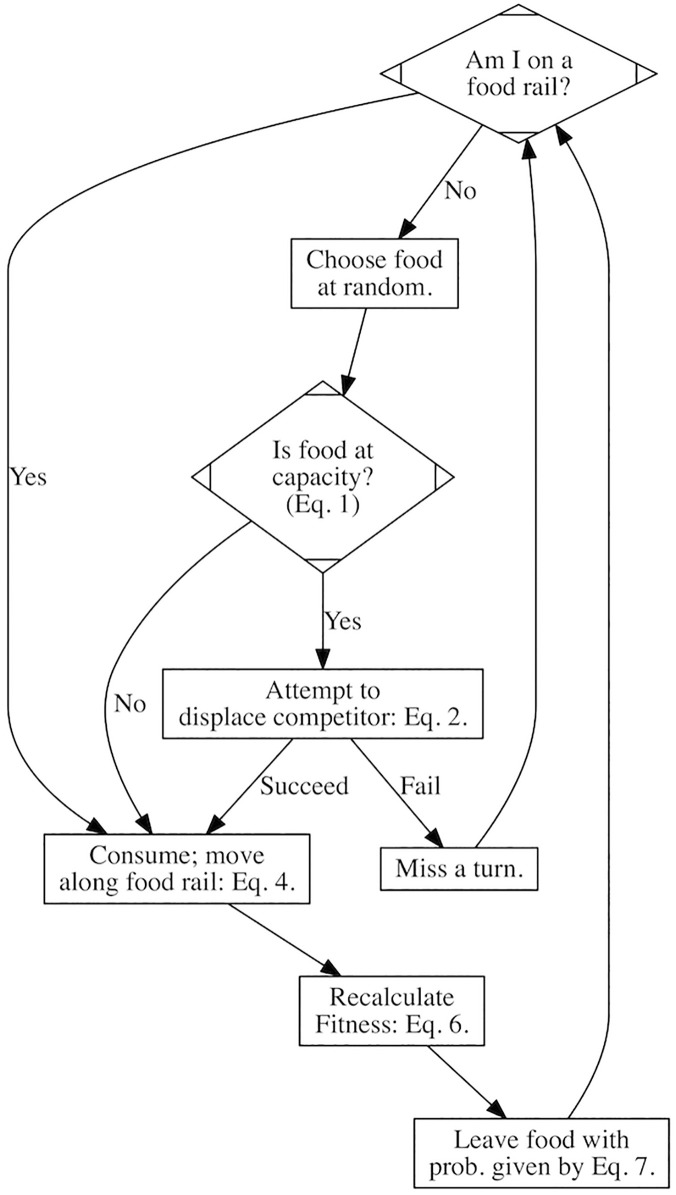
Fig 8. Flow Diagram of Model Processes.
A flow diagram of the model. After 500 iterations of these processes, a new generation begins. Note that all individuals undergo each process before the model moves on to the next process (i.e. for the details of each process see Details in Models) and individuals are processed in a randomised sequence.

