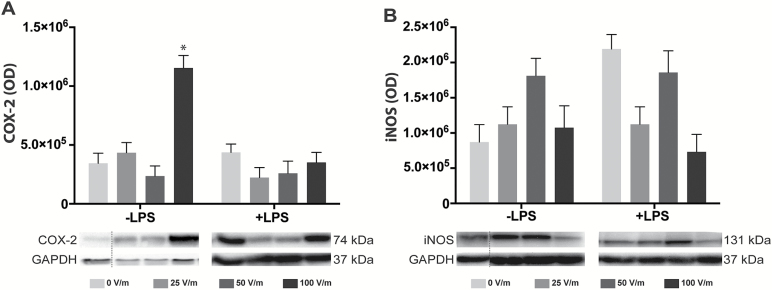
Figure 5.
DCEF effects on inflammatory markers associated with microglial cells. The expression of COX-2 (A) and iNOS (B) was quantified by Western-blot analyses, but no significant changes were noted except for COX-2 expression in BV2 resting microglial cells exposed to 100V/m DCEF. The immunoblots are delineated by a dotted line when they originate from different parts of the same gel. Protein quantification and GAPDH staining determined the homogeneity of sample loading. Values represent LS-means ± SEM. Statistical analyses: split plot ANOVA following log transformation. *P<.05 compared with 0V/m in cells not exposed to LPS (-LPS). COX-2, cyclooxygenase-2; DCEF, direct current electrical field; GAPDH, glyceraldehyde 3-phosphate dehydrogenase; iNos, inducible nitric oxide synthase; LPS, lipopolysaccharide; OD, optical density.

