Figure 6.
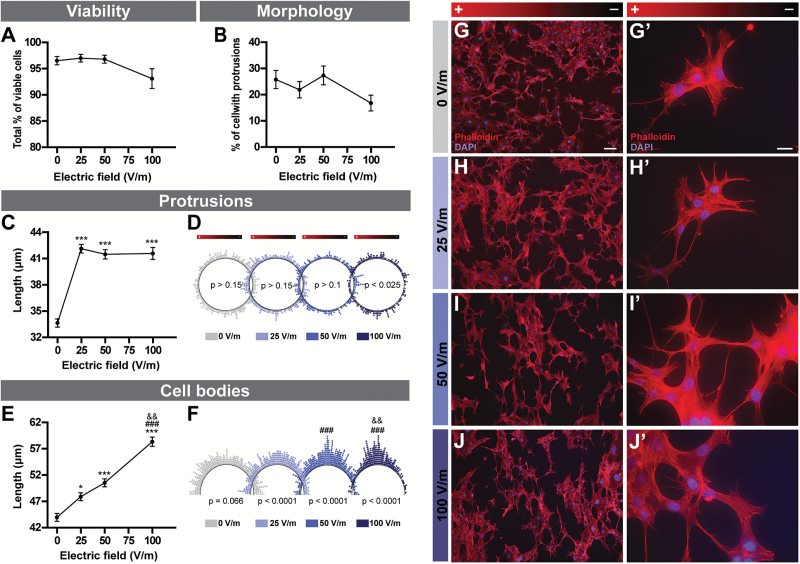
DCEF effects on astrocytes. (A) The viability of C8-D1A murine astrocytes (3–4 replicates, n total=321–724) and (B) the total percentage of cells presenting protrusions (4–5 replicates, n total=586–837) were similar across all DCEFs applied (from 0 to 100V/m). (C) The total length of protrusions (4–5 replicates, n total=278–450) was increased following stimulation with 25, 50, and 100V/m. (D) Polar distribution of the protrusions (each dot represents the angle of a single protrusion). The cell protrusions were oriented perpendicularly (4–5 replicates, n total=278–450) to the DCEF at 100V/m. (E) The total length of cell bodies (4–5 replicates, n total=437–593) steadily increased in 25, 50, and 100V/m DCEF. (F) Polar distribution of cell body angles (each dot represents the angle of a single cell body). The cell bodies were oriented perpendicular (4–5 replicates, n total=437–593) to the DCEF at 25, 50, and 100V/m. The homogeneity of cell body orientation was more prominent with increasing voltages. (G-J) Photomicrographs of double phalloidin (F-actin, red) and DAPI (nucleus, blue) immunofluorescent staining illustrating the morphological and orientational changes in C8-D1A mouse astrocytes in response to DCEFs. (Scale bars G-J: 100 µm, G’-J’: 20 µm). (A-C, E) Data represents LS-means ± SEM. Statistical analyses: (A-B) ANOVA (split-plot-type, binomial), (C, E) ANOVA (split-plot-type) following log transformation. (D) Kuiper’s Test of Uniformity (F) chi-square test using grouped data (number of classes = 8 with identical divisions for interval 0–180°). *P<0.05, ***P<.001 vs 0V/m; ### P<.001 vs 25V/m; && P<.01 vs 50V/m. DCEF, direct current electrical field; LS, least square; V/m, Volt/meter.

