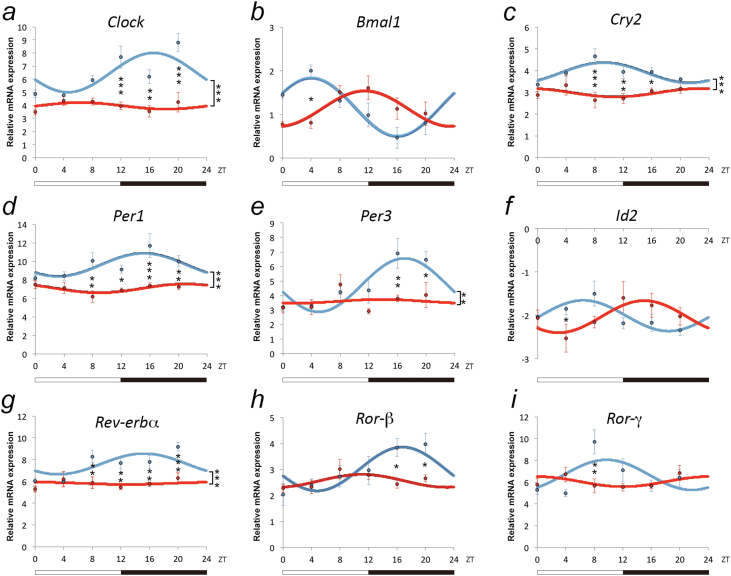
Figure 2.
Modulation of circadian patterns of clock genes expression in the basolateral amygdala (BLA) of anhedonic mice. Data represent relative mRNA expression (dCT) of (a) Clock, (b) Bmal1, (c) Cry2, (d) Per1, (e) Per3, (f) Id2, (g) Rev-erbα, (h) Ror-β, and (i) Ror-γ determined by quantitative real-time PCR (qRT-PCR) of BLA tissue of control (blue) and anhedonic mice (red); total of n=49 for control and n=30 for anhedonic mice. Data are reported as dCT values (inversely proportional to the amount of gene expression) and displayed as mean values ± SEM. Posthoc pair-wise comparisons with Bonferroni correction were carried out when a statistically significant interaction between treatment and Zeitgeber Time (ZT) was detected to determine differences between groups at individual time points. *P<.05, **P<.01, ***P<.001, denote differences revealed by posthoc tests.

