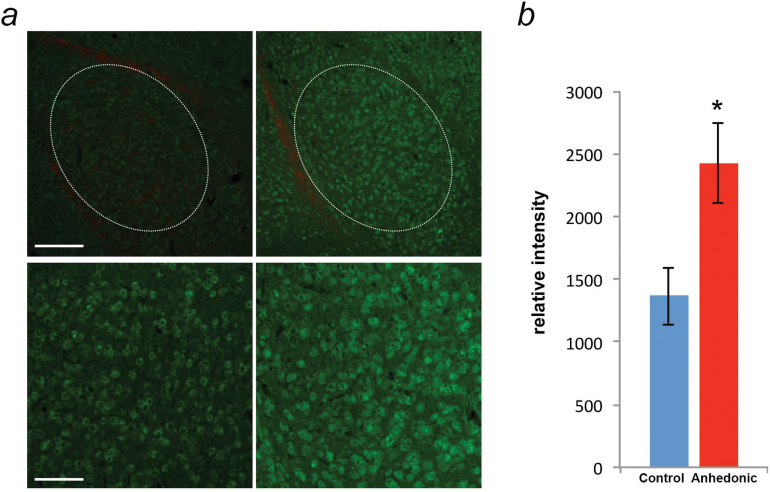
Figure 3.
Alterations of CLOCK protein expression in the basolateral amygdala (BLA) of anhedonic mice. (a) Representative immunofluorescence images of CLOCK protein expression in the BLA of control (left) and anhedonic (right) mice during late day-dusk (Zeitgeber Time [ZT]12). The 30-μm amygdala coronal sections were stained with CLOCK antibody (green) and red Fluoro Myelin (red). Dotted white lines indicate the areas analyzed in each tissue section. Scale bar: upper 200 μm, lower 100 μm. (b) Quantification of relative intensities of CLOCK protein expression in the BLA of control (n=6; blue) and anhedonic (n=7; red) mice at ZT12. Data are displayed as mean ± SEM, * P<.05.

