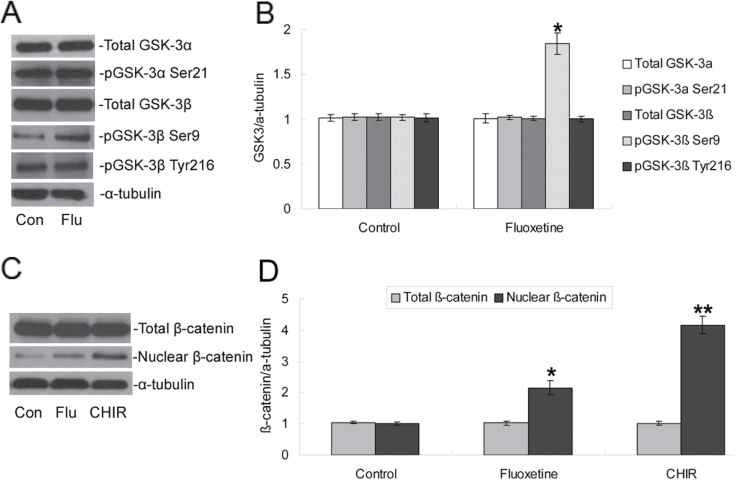
Figure 3.
Effects of fluoxetine on GSK-3β/β-catenin expression in NPCs. NPCs were cultured for 48h in the presence of 1 μM fluoxetine or 3μM CHIR99021. (A) Representative Western blotting of total GSK-3α, phospho-Ser21-GSK-3α, total GSK-3β, phospho-Ser9-GSK-3β, phospho-Tyr216-GSK-3β, and α-tubulin proteins. (B) Quantification of Western blotting signals of GSK3 and α-tubulin proteins. Data were ratios compared with α-tubulin protein. Values represent means ± SD. n = 5 for each group. *p < 0.05 compared with the control group. (C) Representative Western blotting of total β-catenin, nuclear β-catenin, and α-tubulin proteins. (D) Quantification of Western blotting signals of β-catenin and α-tubulin proteins. Data were ratios compared with α-tubulin protein. Values represent means ± SD. n = 5 for each group. *p < 0.01, **p < 0.005 compared with the control group. GSK3, glycogen synthase kinase-3; NPCs, neural precursor cells; SD, standard deviation.

