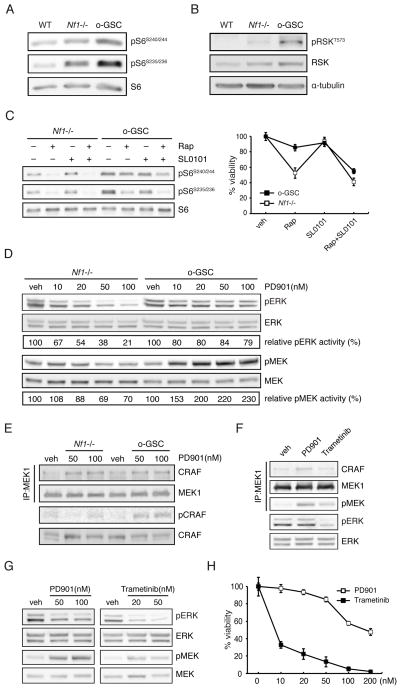
Figure 5. Mechanisms underlying the relative resistance of o-GSCs to rapamycin and PD0325901 treatments.
Increased (A) mTOR activation (S6 phosphorylation) and (B) p90-RSK Thr573 phosphorylation were observed in o-GSCs relative to Nf1−/− TVZ NSCs. (C) Nf1-deficient TVZ NSCs and o-GSCs were treated with rapamycin (0.5nM) and SL0101 (50μM) as indicated. S6 phosphorylation and the percentage of viable cell number are shown. (D) PD901 treatment did not inhibit ERK phosphorylation due to aberrant MEK activation (phosphorylation) in o-GSCs. (E) PD901 treatment induces the formation of MEK1-CRAF complexes, but increased CRAF phosphorylation was only observed in o-GSCs. Trametinib (50nM) reduced (F) CRAF/MEK binding, (G) MEK/ERK phosphorylation and (H) o-GSC growth.

