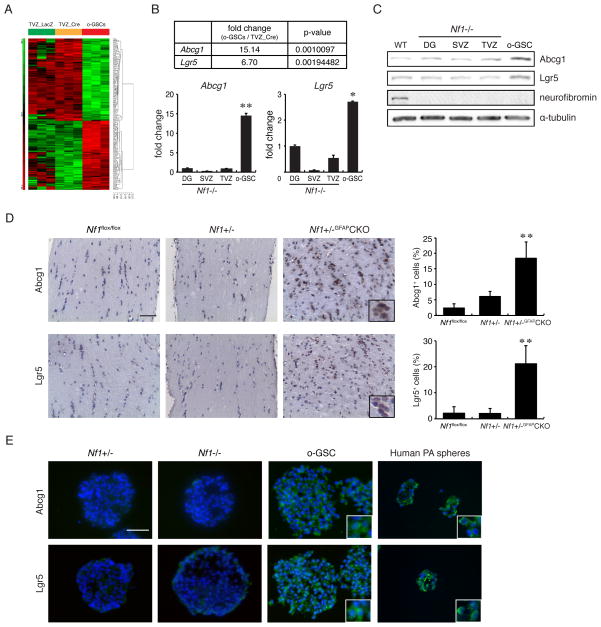
Figure 6. o-GSCs exhibit increased Abcg1 expression.
(A) Hierarchical cluster analysis of WT (TVZ_LacZ), Nf1−/− (TVZ_Cre) NSCs, and o-GSCs. Three independent arrays representing each sample are shown. The expression level represents standardized values from −5 (green, <1-fold change) to 5 (red, >1-fold change). No change is denoted by black. Differential expression of two candidate genes, Abcg1 and Lgr5, was validated by (B) qPCR and (C) Western blotting. (D) Increased numbers of Abcg1+ and Lgr5+ cells were found in Nf1 mouse optic gliomas compared to non-tumor-bearing optic nerve sections from WT (Nf1flox/flox) and Nf1+/− mice (n=4 per group). (E) Immunocytochemistry reveals Lgr5 and Abcg1 expression in mouse o-GSCs and spheres from human PAs. DG, dentate gyrus; SVZ, subventricular zone; TVZ, third ventricle. Error bars denote mean ± SD. Nuclei are counterstained with DAPI. Scale bars, 100 μm. (*) p<0.01; (**) p<0.001.

