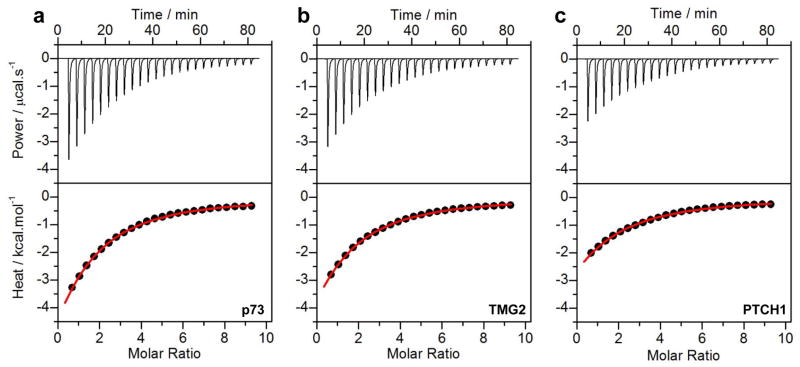
Figure 2.
Representative ITC isotherms for the binding of isolated WW1 domain of WWOX to p73 (a), TMG2 (b) and PTCH1 (c) peptides. The upper panels show the raw ITC data expressed as change in thermal power with respect to time over the period of titration. In the lower panels, change in molar heat is expressed as a function of molar ratio of corresponding peptide to WW1 domain of WWOX. The solid red lines in the lower panels show the fit of data to a one-site binding model using the integrated ORIGIN software as described earlier (13, 33).

