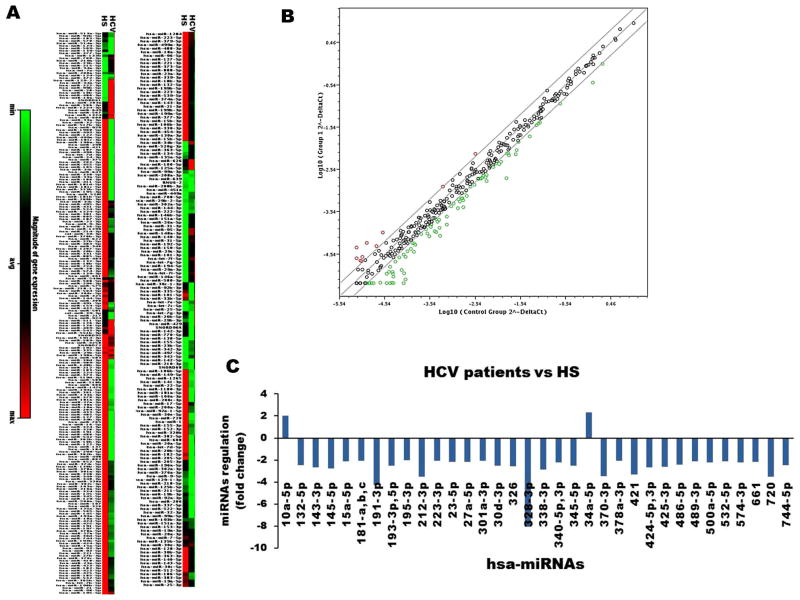
Fig. 1. miRNA expression array in CD4+ T cells from chronically HCV-infected individuals versus HS.
A) Heat maps showing differentially expressed miRNAs in CD4+ T cells. Each column represents results from samples of 6 HCV-infected individuals and 6 HS, respectively. Each row corresponds to a single miRNA probe. Colors indicate the level of miRNA expression (red, high level; green, low level). B) Scatter plot of the log base 10 for the intensity of each miRNA in the two groups (x-axis, HS shown as control group; y-axis, HCV-infected group). The middle line indicates a fold-change (2−ΔCt) of 1. The top and the bottom lines indicate the desired 2 fold-change in miRNA expression threshold. The red points above the top line represent upregulated miRNAs. The green points below the bottom line represent downregulated miRNAs. C) Differentially upregulated and downregulated miRNAs from HCV-infected individuals compared to those from HS.

