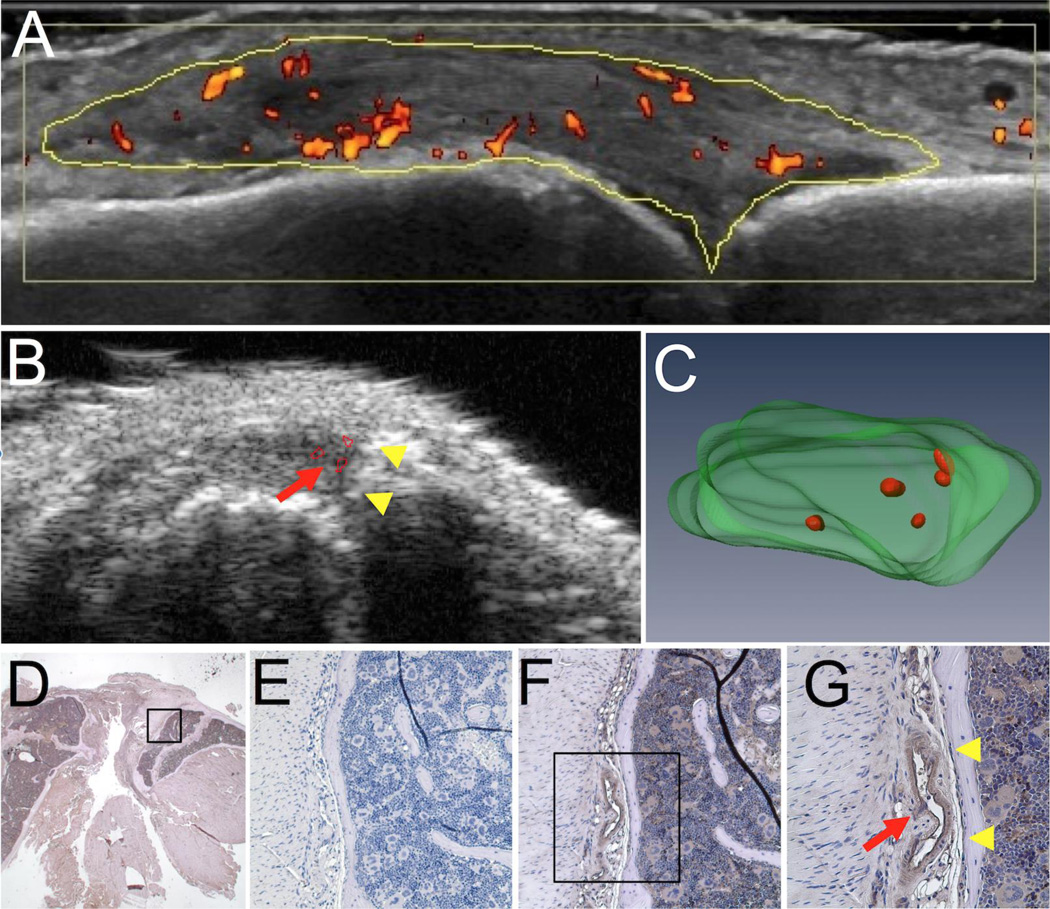
Figure 2. Corroboration of the PD-US signal with immunohistochemistry for CD31+ blood vessels in the joint space.
A PD-US image is shown to illustrate the resolution and the sensitivity of the PD signal (red heat map) in the metacarpophalangeal joint space (yellow outline) from a rheumatoid arthritis patient experiencing hyperemia of the synovium (A). TNF-Tg mice (8–10 months) underwent PD-US as described in Figure 1, and the knee joints were harvested for immunohistochemistry. A representative 2D image of the B-mode with PD signal (red arrow in B), with the corresponding 3D rendering of the joint space and PD signal (green and red, respectively in C) from PD-US are shown to highlight the vascular regions in the tissue that were subsequently evaluated by immunohistochemistry. Histology sections of the joint corresponding to the vascular regions in the PD-US images were processed for immunohistochemistry with antibodies specific for CD31. Micrographs of the joint space are shown at low magnification (1.25×; D) where the box highlighted is shown at 20× for the negative control (E) and CD31+ blood vessels (brown in F). The box highlighted in F is shown in G at 40×. Note the proximity of the blood vessel (red arrow in G) to the joint surface (yellow arrowheads in G), corresponding to the close proximity of the PD signal (red arrow in B) to joint surface (yellow arrowheads in B) shown in PD-US.

