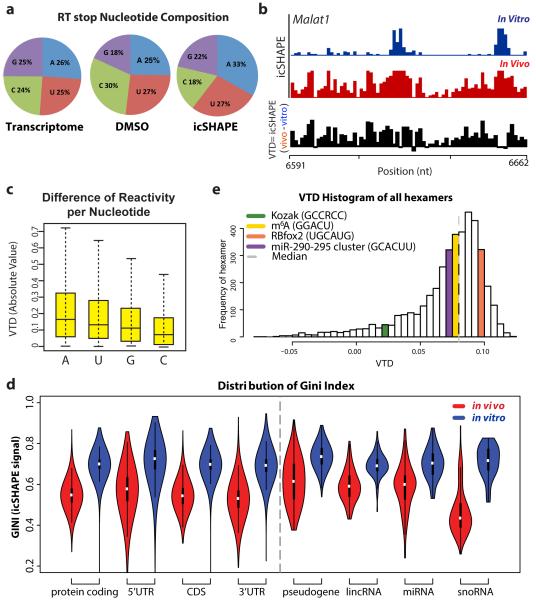
Figure 2. icSHAPE Reveals Unique Structural Profiles for Nucleobase Reactivity and Posttranscriptional Interactions.
a, RT stop distribution for the transcriptome, DMSO control, or icSHAPE libraries. b, icSHAPE data track and VTD calculation of the MALAT1 RNA (chr19:5796010-5796081). icSHAPE data are scaled from 0 (no reactivity) to 1 (max reactivity). c, The VTD distribution for icSHAPE libraries. d, GINI index of icSHAPE data in vivo vs. in vitro. e, The distribution of VTD profiles for all hexamer motifs across the transcriptome. Bin locations for several motifs for post-transcriptional regulation are highlighted.

