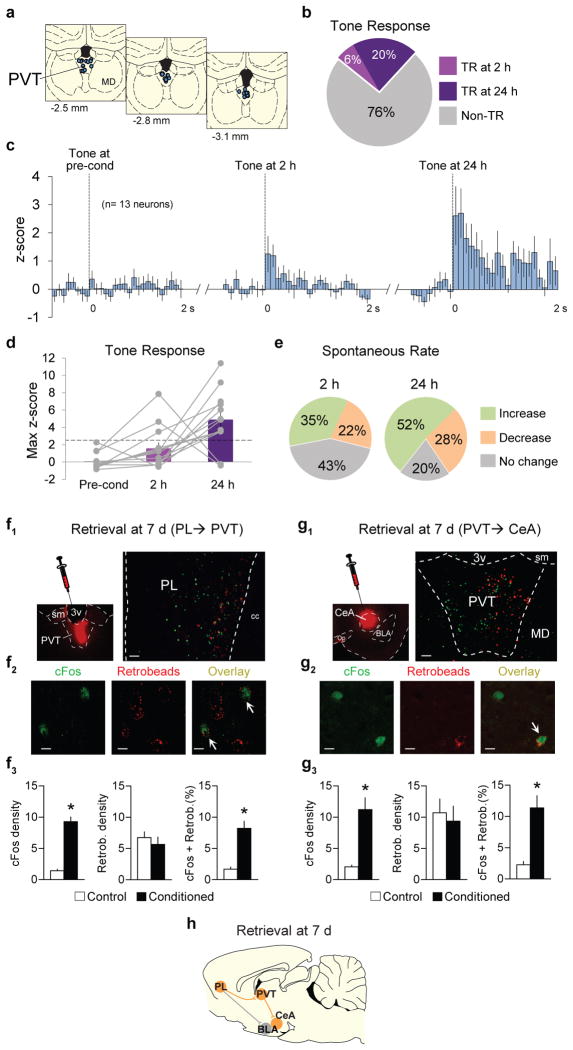
Figure 3. Time-dependent increases in tone responses of PVT neurons following fear conditioning.
(a) Diagram of recording placements in PVT. Coordinates from bregma. (b) Percentage of tone responsive (TR) neurons at 2 h and 24 h following conditioning (n= 54 neurons, 6% tone responsive at 2 h, 20% tone responsive at 24 h, Fisher exact test, P= 0.04). (c) Average peri-stimulus time histograms of all PVT neurons that were significantly tone responsive at either 2 h or 24 h after conditioning (n=13 neurons). (d) Maximum z-score for group data (bars) or individual data (gray lines, n=13 neurons). Dashed line indicates a z-score criterion of 2.58. (e) Changes in spontaneous firing rates of PVT neurons at 2 h (left) and 24 h (right) after conditioning, compared to pre-conditioning. Changes at 24 h were significantly greater than 2 h (n= 54 neurons; 24 h= 80%; 2 h= 57%, Fisher exact test, P= 0.02). (f1,left) Micrograph showing the site of retrobeads infusion into PVT. (f1, right) Micrograph showing PL neurons projecting to PVT (retrogradely labeled, red) expressing immunoreactivity for cFos (green) following fear retrieval at 7 d. Scale bar,100 μm. (f2) Confocal images showing cFos labeling (left), retrobeads labeling (middle), and overlay (right) of PVT-projecting PL neurons (white arrows). Scale bar,10 μm. (f3) Fear retrieval at 7 d increased the number of cFos positive neurons (per 0.1 mm2) in PL (left, P= 0.003, t= 8.74), but the number of retrogradely labeled PL neurons was the same between groups (middle, P= 0.51, t= −0.7). Retrieval increased the percentage of retrogradely labeled PL neurons expressing cFos (right, P= 0.004, t= 4.83; n=3–4 per group). (g1,left) Micrograph showing the site of retrobeads infusion into CeA. (g1,right) Micrograph showing PVT neurons projecting to CeA (retrogradely labeled, red) expressing immunoreactivity for cFos (green) after fear retrieval at 7 d. Scale bar,100 μm. (g2) Confocal images showing cFos labeling (left), retrobeads labeling (middle), and overlay (right) of CeA-projecting PVT neurons (white arrow). Scale bar,10 μm. (g3) Fear retrieval at 7 d increased the number of cFos positive neurons (per 0.1 mm2) in PVT (left, P= 0.03, t= 3.71), but the number of retrogradely labeled PVT neurons was the same between groups (middle, P= 0.79, t= −0.28). Retrieval increased the percentage of retrogradely labeled PVT neurons expressing cFos (right, P= 0.03, t= 3.61; n=2–3 per group). (h) Schematic of potential circuit mediating fear retrieval at 7d timepoint. Data are shown as mean ± SEM; Unpaired t-test between control and conditioned groups; *P < 0.05.

