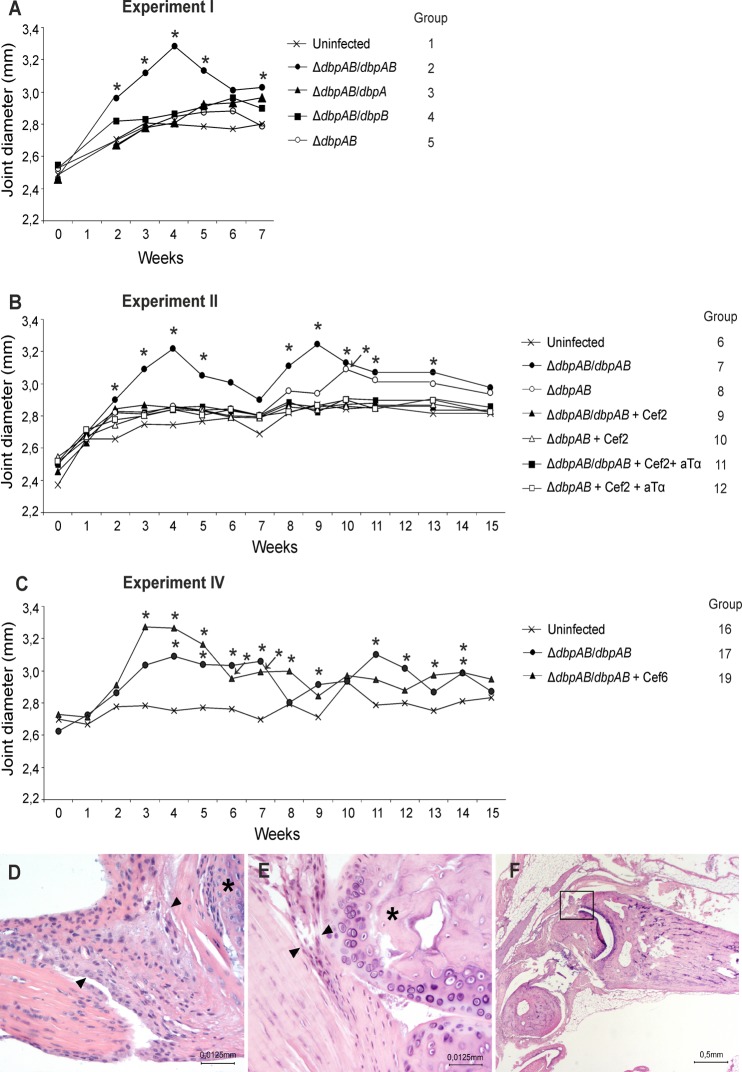
Fig 2. Joint swelling and histology.
In experiment I (A), II (B) and IV (C), the development of joint swelling was monitored by measuring the medio-lateral diameter of the hind tibiotarsal joints once a week. Each curve represents the mean of the study group. Asterisks denote significant difference from uninfected mice (P ≤ 0.05). Paraffin-embedded tissue sections were prepared from ΔdbpAB/dbpAB (D; group 7) and ΔdbpAB (E; group 8) infected and uninfected control (F; group 6) mice at 15 weeks of infection and stained for HE. Arrowheads indicate the synovial membrane, and asterisks indicate articular cartilage surface in panels D and E. The original magnification in panels D and E is ×400 and in panel F ×20. Panel F indicates the anatomical structure shown in panels D and E. “Cef” Ceftriaxone treatment, “aTα” anti-TNF-alpha treatment.

