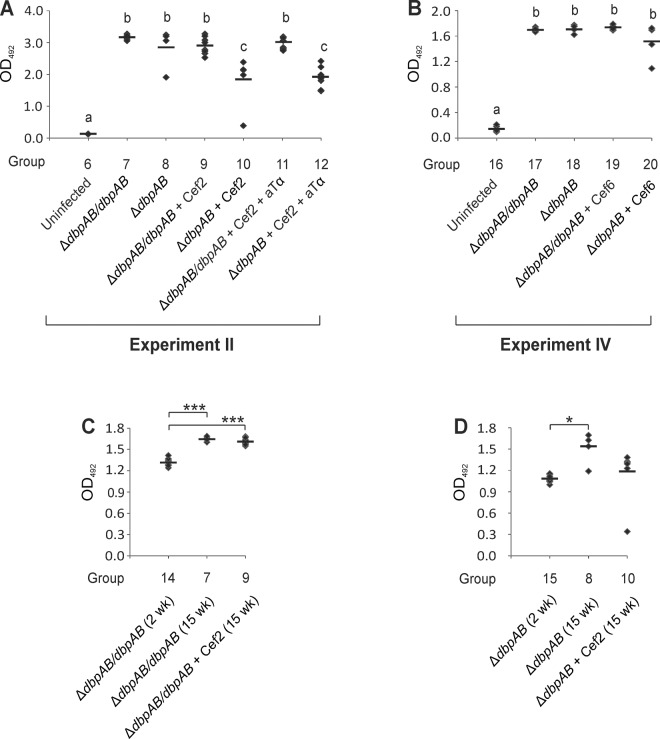
Fig 3. IgG antibody levels in mouse serum samples.
Antibody levels were measured using enzyme immunoassays with whole B. burgdorferi lysate as antigen. In panel A, the results are from Experiment II, in panel B from Experiment IV, and in panels C and D combined from Experiments II and III. The results in each panel are obtained from an individual analysis. Each symbol represents the result of one animal. Results are expressed as OD492 values and all samples were analysed in duplicate. The line indicates the mean of each group. Groups with the same letter do not differ at 5% level of probability (Tukey’s HSD test, panels A and B). * P ≤ 0.05, *** P ≤ 0.001.

