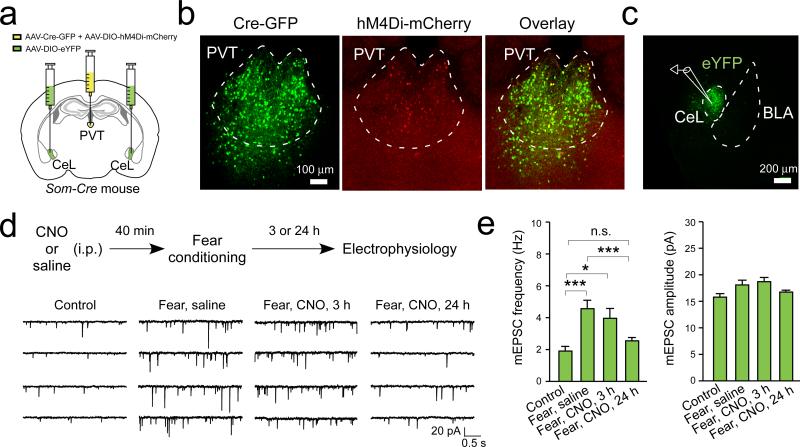
Figure 2. pPVT is required for the maintenance of fear conditioning-induced synaptic plasticity in CeL.
a. A schematic of the experimental approach. b. Representative images showing the expression of Cre-GFP and hM4Di-mCherry in pPVT. c. SOM+ (eYFP+) CeL neurons in acute slices were targeted for recording. d. Top: a schematic of the experimental procedure. Bottom, representative traces of mEPSCs recorded from SOM+ CeL neurons in mice of the following groups (from left to right): 1) naïve control; 2) fear conditioned, treated with saline and sacrificed 24 hours following conditioning; 3) fear conditioned, treated with CNO and sacrificed 3 hours following conditioning; and 4) fear conditioned, treated with CNO and sacrificed 24 hours following conditioning. e. Quantification of mEPSC frequency (left) and amplitude (right). Frequency, F(3,89) = 8.4, *P < 0.05, ***P < 0.001, n.s., non-significant (P > 0.05) (Control, n = 16 neurons (3 mice); “Fear, saline”, n = 27 neurons (4 mice); “Fear, CNO, 3 h”, n = 16 neurons (3 mice); “Fear, CNO, 24 h”, n = 34 neurons (3 mice)); Amplitude, F(3,89) = 2.9, P < 0.05 (no significant difference was detected in the post-hoc analysis); one-way ANOVA followed by Tukey's test. Data are presented as mean ± s.e.m.

