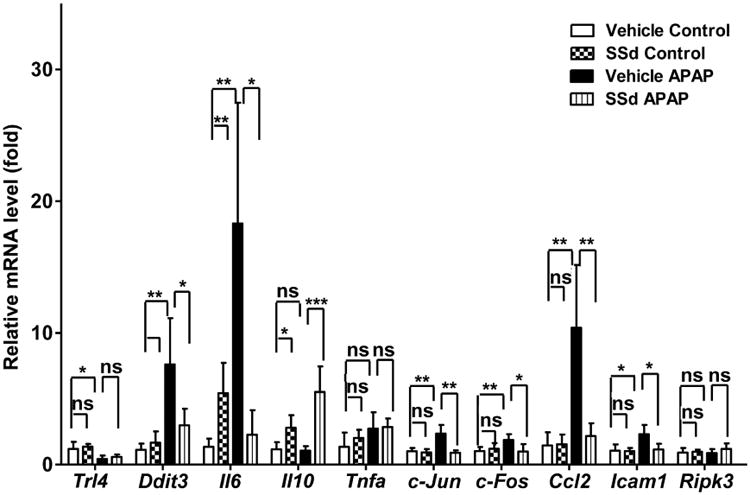
Fig. 5.

The levels of mRNAs encoded by genes associated with the inflammatory response. Data were from liver samples collected 24h after APAP treatment. The mRNA expression levels were measured by qPCR and normalized by 18S rRNA. Messenger RNA expression level in the vehicle control mice was arbitrarily set as 1 and results expressed as mean ± SD (n=5; *p<0.05; **p<0.01; ***p<0.001; ns, not significant).
