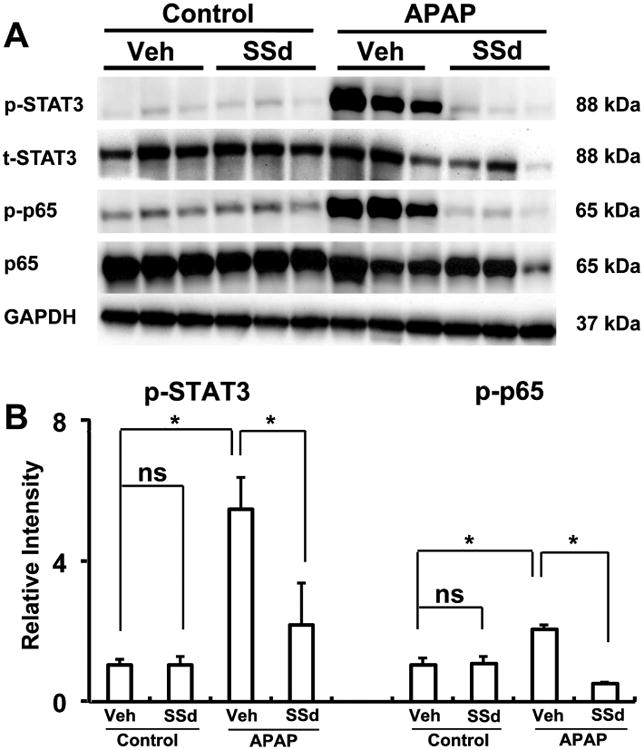
Fig. 6.

Western blot and densitometry analysis of STAT3 and NFκB in liver extracts. Liver samples were collected 24h after vehicle (Veh) + APAP treatment and SSd + APAP treatment. GAPDH was used as a loading control. The molecular weight was indicated at the right side of the respective band. A: Western blot of STAT3 and NFκB in liver extracts. B: Densitometry analysis of STAT3 and NFκB activation in liver extracts. Results of control group were set as 1 and data were expressed as relative intensity of p-p65 and p-STAT versus p65 and STAT respectively (n=3; *p<0.01; ns, not significant).
