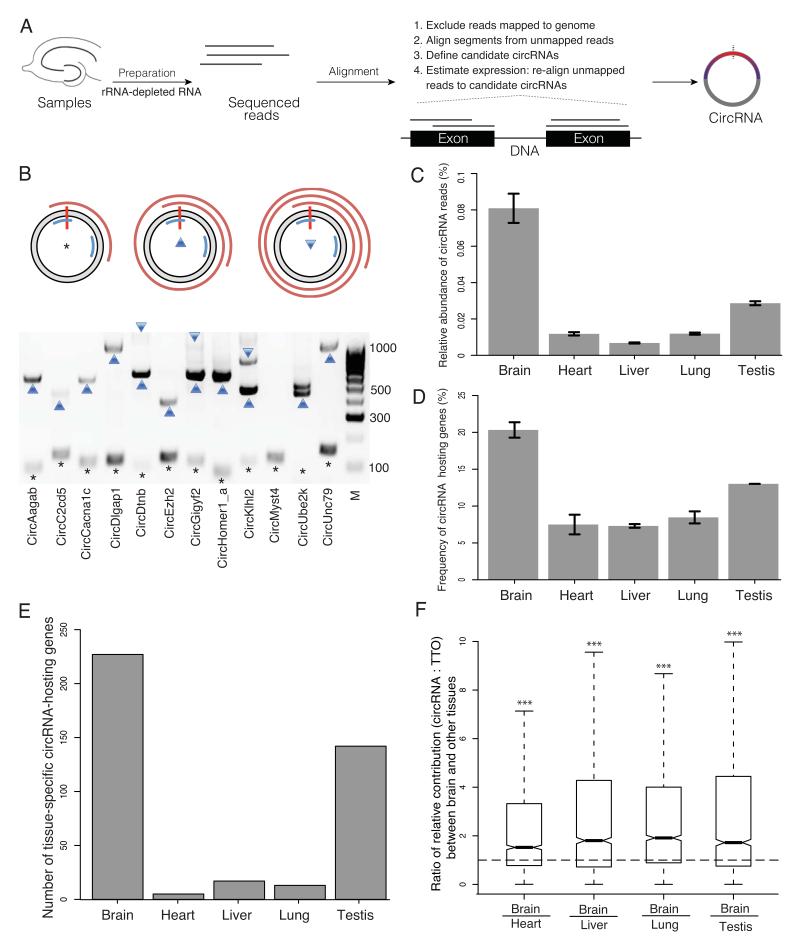
Figure 1. Profiling of circRNAs across tissues reveals enrichment in brain.
A. Experiment and analysis pipeline. B. The rolling cycle cDNA products from circRNAs. The grey ring represents a circRNA with the red vertical bar marks the head-to-tail junction. Two blue arcs mark the PCR primers. The red spirals on the outside represent PCR products that were deep sequenced by PacBio technology. The asterisk, upward triangle and downward triangle symbols on the gel image denote the 0-cycle, 1-cycle and 2-cycle RT products identified by PacBio sequencing, respectively. Eleven out of 12 circRNAs tested generated rolling cycle products (the exception was circMyst4). C. The percentage of circular junction reads from all the reads mapped on the genome is shown for different tissues, with the highest value (0.75-0.87%) in brain, followed by testis (0.28-0.29%). D. The percentage of genes that produced circRNAs from all the expressed genes is shown across different tissues, with the highest value (20-21%) in brain, followed by testis (13%). E. The number of circRNA host genes that are exclusively expressed in one tissue is shown across different tissues, with the highest value in brain, F. The relative contribution of circRNA to the total transcription output of the same gene locus i.e. the ratio between the abundance of each circRNA and the total transcriptional output (TTO) of the hosting gene loci (measured in TPM, transcripts per million) is significantly higher in brain compared to all other tissues, The ratios of the relative contribution between brain and other four tissues are significantly larger than one (two-sided one-sample t-test, *** p < 2.2E-16). C.-F. Tissues were obtained from two animals.

