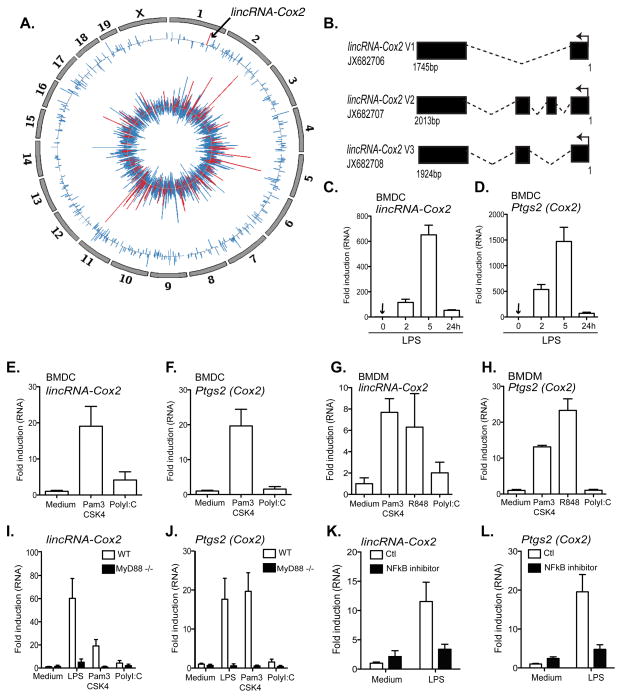
Figure 1. lincRNA-Cox2 expression is induced by TLR ligands in a MyD88 and NFκB dependent manner.
A, The Circos plot shows genome-wide differential expression (RNA-seq) between untreated bone marrow derived macrophages (BMDM) and BMDMs stimulated with Pam3CSK4 (TLR1/2) (5 h). The inner track shows log2 fold-change values for protein coding genes that are classified into immune genes (red, see methods) and other genes (blue). The outer track shows log2 fold-change value for all lncRNAs. lincRNA-Cox2 is highlighted in red on Chromosome 1 (arrow). B, lincRNA-Cox2 encodes three splice variants. C–H, qRT-PCR was performed on bone marrow derived dendritic cells (BMDC) (C–F) or bone marrow derived macrophages (BMDM). Elevated levels of lincRNA-Cox2 and Ptgs2 were observed following LPS (TLR4) (C–D), Pam3CSK4 (TLR2) (E–H), R848 (TLR7/8) (G–H) but not with Poly I:C (TLR3) (E–H) stimulation. I–J. Induction of lincRNA-Cox2 and Ptgs2 were found to be dependent on MyD88 following qRT-PCR on BMDMs obtained from wild type (WT) or MyD88 KO mice. K–L, BMDMs treated for 30min with an NFκB inhibitor (1 μg/ml), followed by stimulation with LPS (100 ng/ml) resulted in reduced expression levels of lincRNA-Cox2 (K) and Ptgs2 (L) as examined by qRT-PCR. Data represents mean ±SD from three independent experiments.

