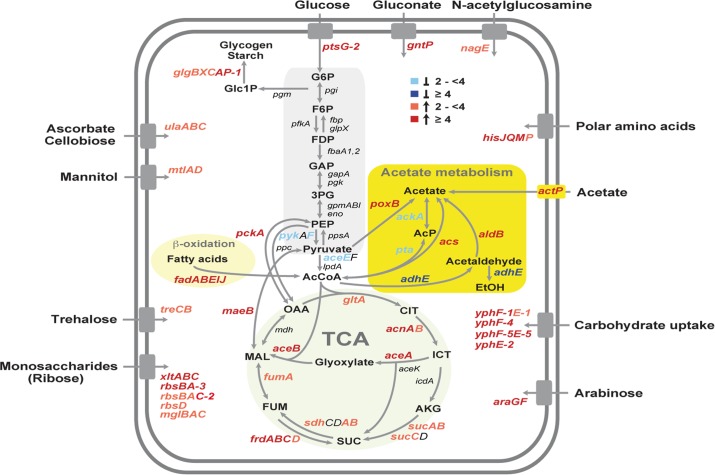
Fig 4. Temperature-dependent reprogramming of the primary metabolism of Y. pseudotuberculosis.
Glycolysis, acetate metabolism, β-oxidation of fatty acids, the TCA cycle and transport systems are illustrated and the genes, designated according to the annotated YPIII genome, which encode equivalent enzymes of the presented pathways are given. Genes which are differentially expressed in response to temperature are colored. The blue color shows genes induced at 25°C (≥4, dark blue, ≥2 light blue), and the red color represents genes upregulated at 37°C (≥4, dark red, ≥2 light red). The values of the expression changes are listed in S4 Dataset.

