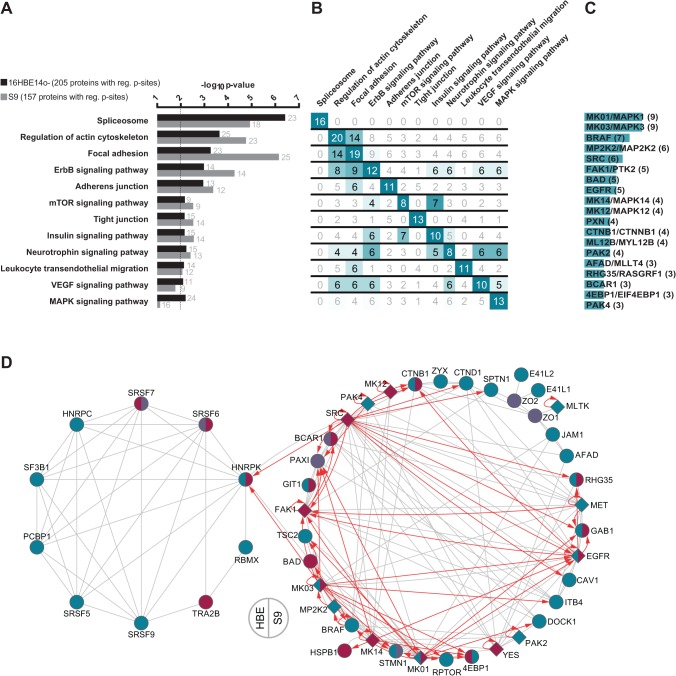
Fig 3. Functional annotation analysis of proteins with altered phosphorylation in rHla-treated 16HBE14o- and S9 cells.
A. KEGG pathways with statistically noticeable number of proteins with altered phosphorylation following rHla-treatment for 2 h. The dotted vertical line indicates the cut-off for significant enrichment (Benjamini-Hochberg corrected p-value ≤0.01). Numbers next to the horizontal bars provide the number of assigned proteins. B. Matrix for cross-comparison of recurrent proteins with altered phosphorylation in both cell types between KEGG pathways from panel A. Numbers greater than the half of the maximum possible are highlighted. C. Ranking of phosphoproteins with altered phosphorylation that appear in at least three enriched KEGG pathways. D. Network visualization of proteins from the enriched KEGG pathways that have been identified with altered phosphorylation in both cell lines. Grey lines indicate experimentally validated protein-protein-interactions and red arrows kinase-substrate relationship taken from STRING and PhosphoSitePlus, respectively. rHla-induced changes are indicated in ruby (increased p-sites); cyan (decreased) or purple (both) for kinases (diamond shape) and substrates (circles) for 16HBE14o- cells (left half of shape) and S9 cells (right).

