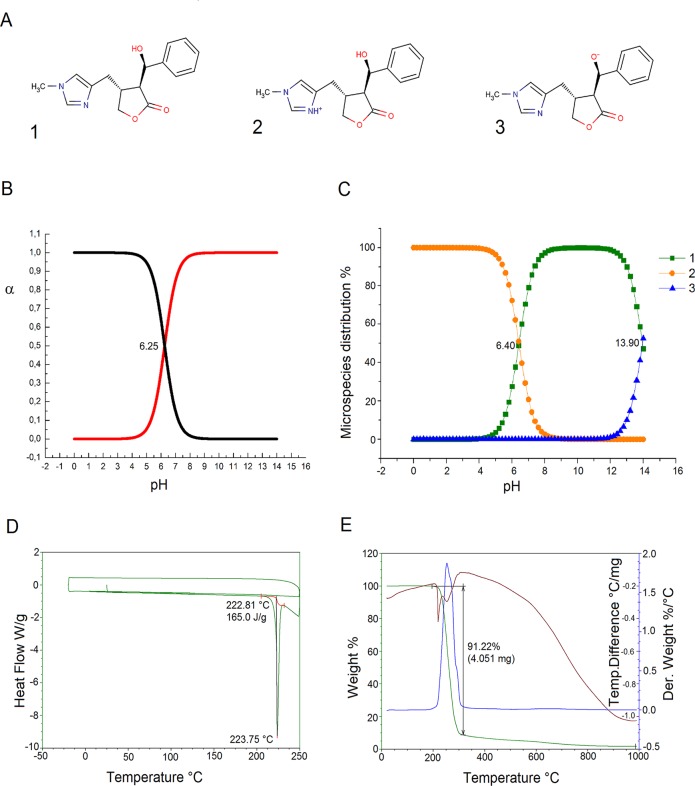
Fig 1. Neutral and ionic forms of EPI (A).
Potentiometric pKa determination (B). Illustration of the pKa values of EPI predicted using the ChemAxon method (C). This graph shows the variation in the of distribution species vs pH values, and indicates that the ChemAxon predicted pKa values are respectively pKa1 = 6.40 and pKa2 = 13.90 (C). DSC (D) and DSC-TGA (E) data illustrating the thermal degradation that occurs around 220°C in a single step.

