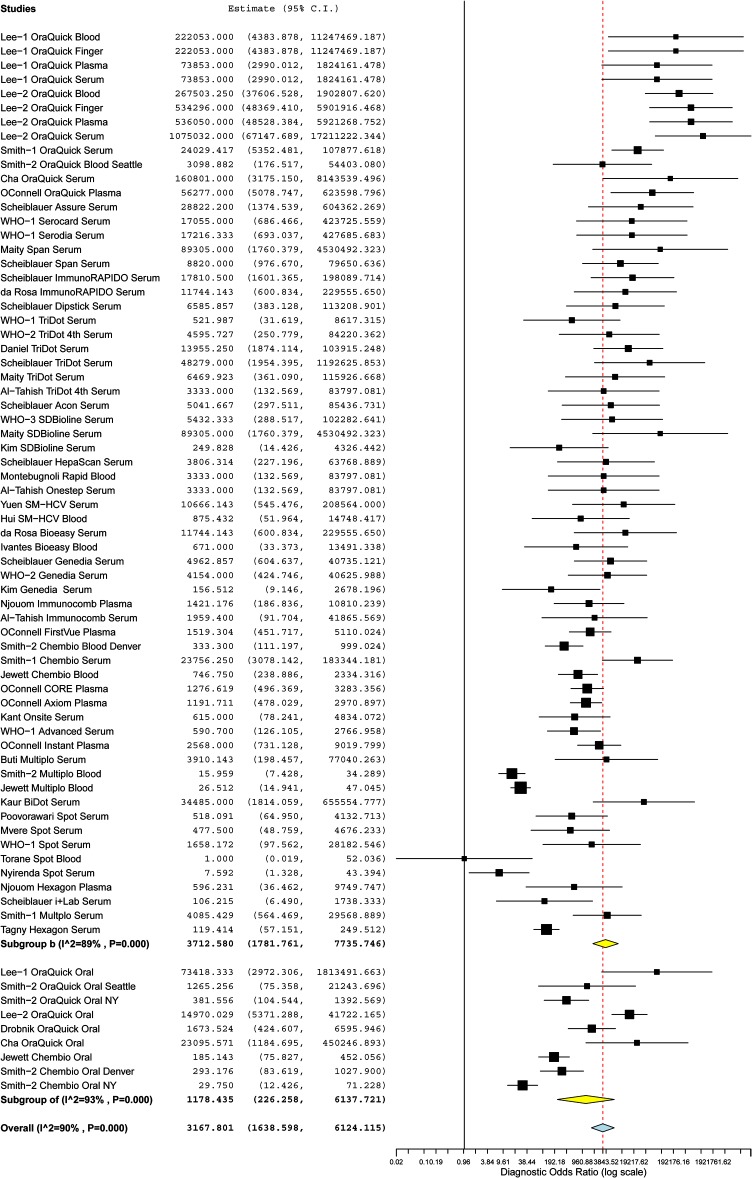
Fig 2. Forest plot of the diagnostic odds ratio on a log scale and 95% confidence intervals (CIs) of 30 studies stratified by specimen type.
Whole blood, finger stick, plasma, and serum samples generated 64 data points (subgroup B) and oral fluid samples generated 9 data points (subgroup OF). Diagnostic odds ratios for each data point are shown as solid squares. Solid lines are 95% CIs. Squares are proportional to the weights based on the random effect model. Pooled estimates and 95% CIs are denoted by the diamond at the bottom of each subgroup list. I2 and P values indicate the heterogeneity of the studies.

