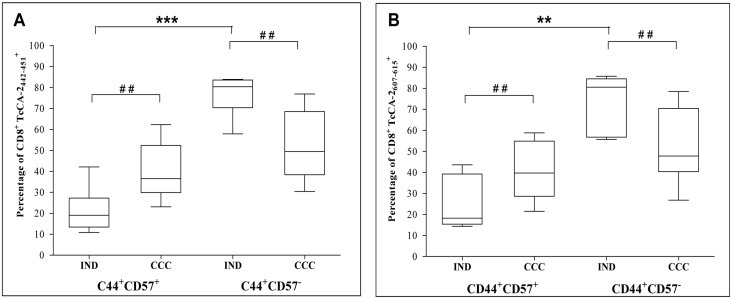
Fig 4. Expression of the senescence marker CD57 in antigen-experienced specific CD8+ T cells.
(A) TcCA-2442-451-specific T cells. (B) TcCA-2607-61-specific T cells. Cells from 6 patients in asymptomatic phase (IND) and 11 patients with the cardiac form (CCC) were analyzed. Median values are represented by horizontal lines. Error bars represent standard deviation intervals. Statistical analyses were carried out using Mann-Whitney U test (#) and Kruskal—Wallis test with Dunn correction (*). Statistically significant differences are indicated (#) or (*) p≤0.05, (# #) or (**) p≤0.01, (# # #) or (***) p≤ 0.001.

