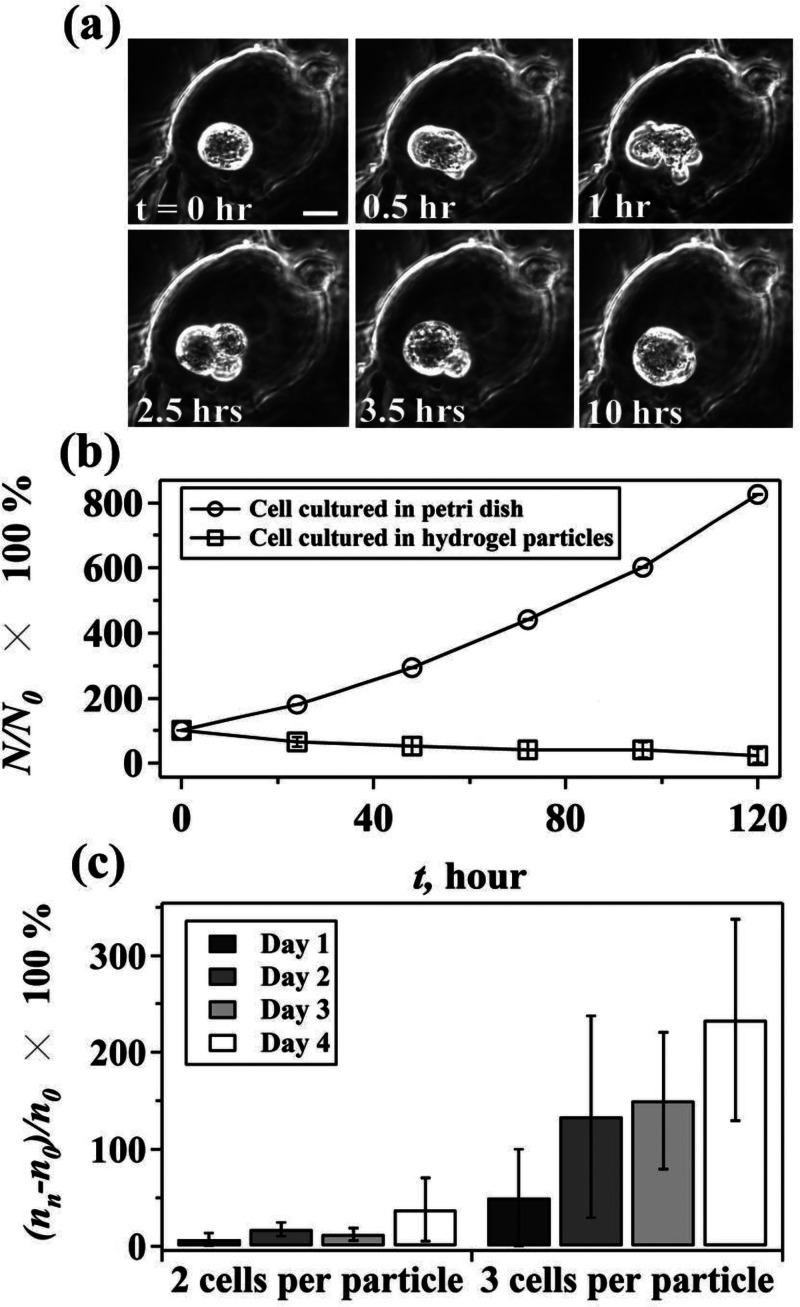
Proliferation of human HCT116 colon cancer cells in hydrogel particles. (a) Time-series image of the growth of a single cell in a hydrogel particle. Note that at
t = 3.5 h, daughter cells begin to shrink back into their maternal cell (scale bar = 10
μm). (b) Percentage of living cells at different time when cells are cultured in petri dish and hydrogel particles.
N0 is the number of living cells at
t = 0 h, and
N is number of living cells at
t = n hours (n = 24, 48, 72, 96, and 120). (c) The net growth rate (
nn −
n0)/
n0 × 100%) of cells encapsulated in hydrogel particles.
nn is the number of particles containing 2 or 3 cells quantified at day
n,
n = 1, 2, 3, and 4.
n0 is the number of particles containing 2 or 3 cells collected at day 0. Error bar is presented as standard deviations of the mean. (Multimedia view) [URL:
http://dx.doi.org/10.1063/1.4916508.1]
Download video file (461.2KB, mp4) DOI: 10.1063/1.4916508.1