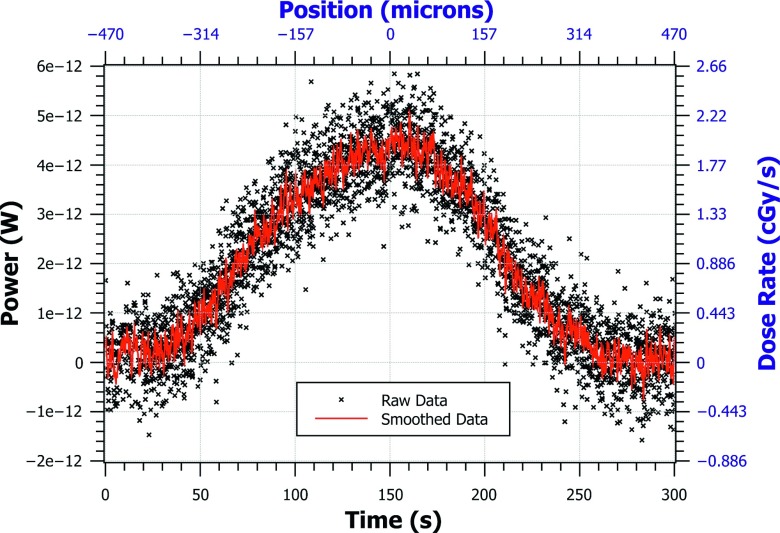
FIG. 5.
The nano-FOD tip was translated through the microbeam to obtain this 1D beam profile of dose rate. The raw data were acquired as a function of time since the optical power can be converted to real-time dose rate as shown in Eq. (1). The position of the translational stage was obtained by multiplying the translation speed by the diode data timestamps. The left and bottom axes (black) are the units of raw data. The right and top axes (blue) are converted units. Time zero represents the right edge of the beam and time 300 s represents the left edge of the beam as the stage was moved from right-to-left.

