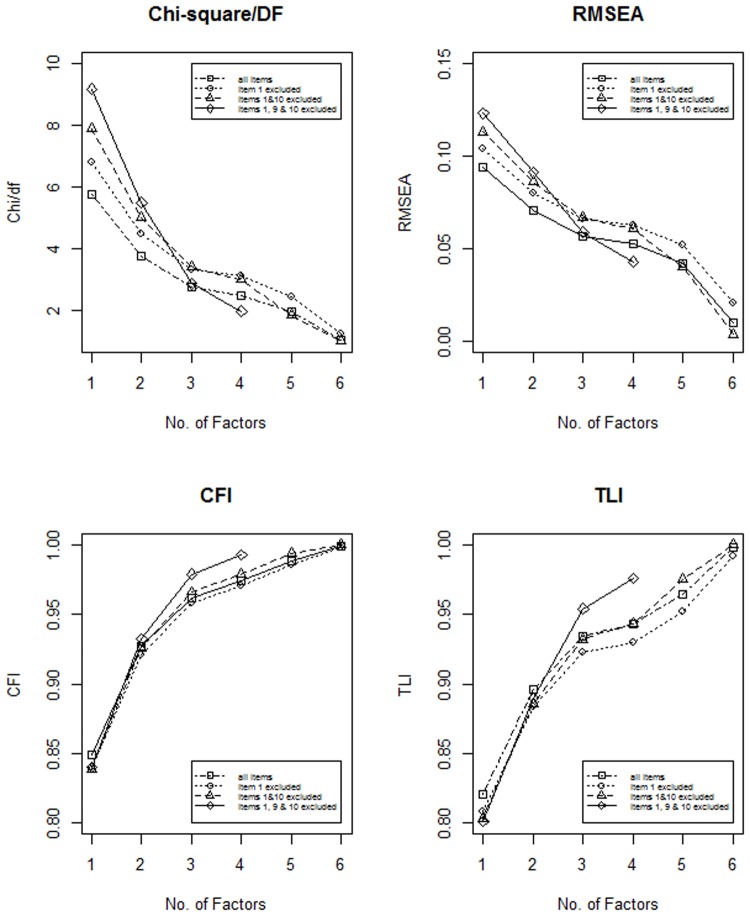
Fig 1. The fit indices of the ESEM models of ER.
The X-axis is always the number of factors, while the Y-axis is a fit index. Upper left corner: Chi-square / degrees of freedom. Upper right corner: Root mean square error of approximation. Lower left corner: Comparative Fit Index. Lower right corner: Tucker-Lewis Index. Different types of lines mark the number of items included in the analysis (first item 1 was excluded, then item 10, then item 9). Factors did not converge after the exclusion of the three ill-fitting items above four solutions. The ‘elbow’ is visible at three factors in all cases.

