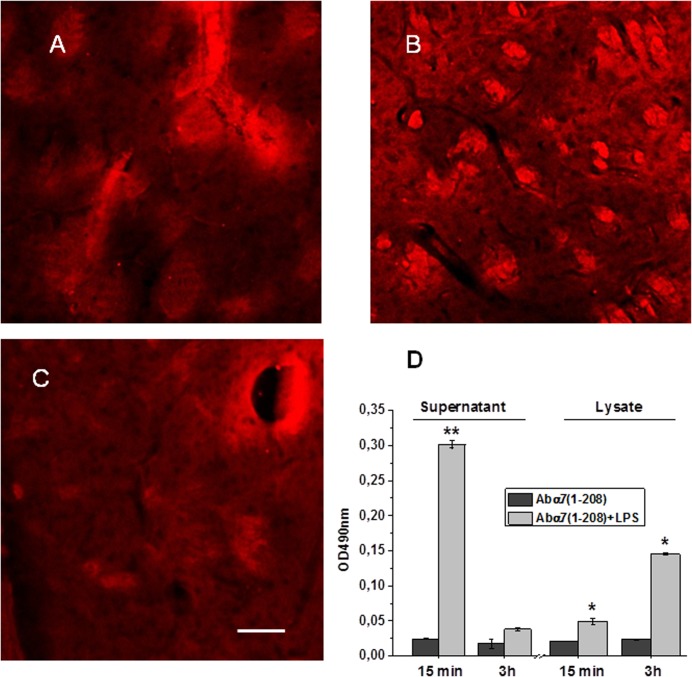
Fig 6. Visualization of biotinylated antibody within the brain at different periods after injection.
Confocal microscopy images of the striatum of mice injected with α7(1–208)-specific antibody (A-B) or non-specific IgG (C) in 15 min (A) or 3h (B-C) after injection. Antibodies were developed with Extravidin-Cy3 (red). Bar corresponds to 100μm, actual for each fragment of the panel. D—Antibody-specific ELISA signal of the primary brain supernatants and detergent lysates of mice either pre-treated or not with LPS; the brains were removed in 15 min or 3 h after the antibody injection. Each column corresponds to mean±SE of three repeats in ELISA; *—p<0.05; **—p<0.005 compared to the data of LPS non-treated mice.

