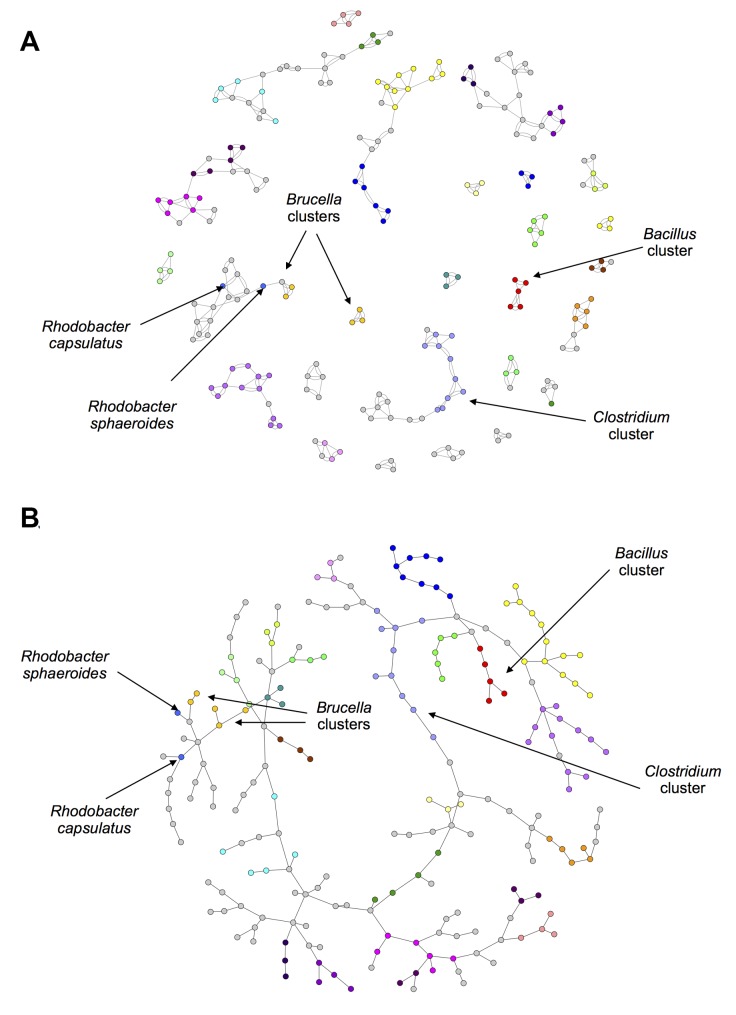
Fig 5. 2-way Czekanowski Networks.
(a) 2-way Czekanowski Best Edges Network (b) Maximum Spanning Tree (MST) of the all-vs-all Czekanowski network. 3-way Sørensen network pruned by selecting the best and second best edge for each node. Nodes represent bacterial species and edges represent similarity between pairs of bacterial species based on gene family content, quantified using the 3-way Sørensen Index. Nodes are coloured according to genus. The same node colour key as in Fig. 2 applies.

