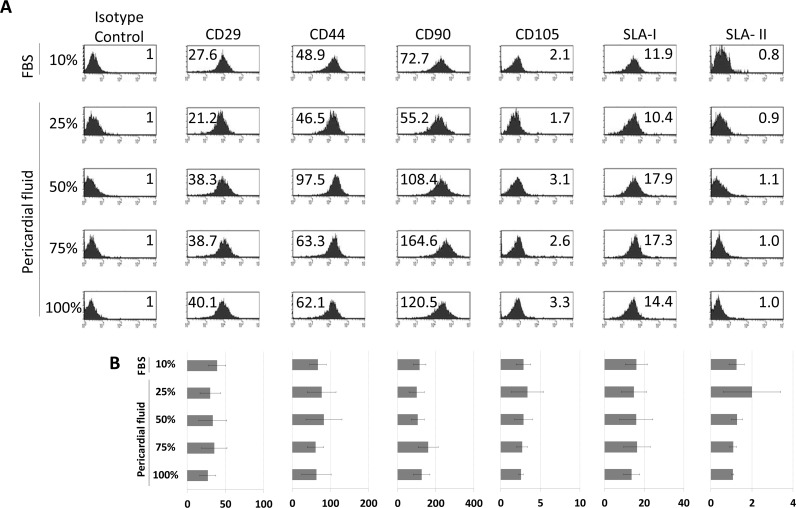
Fig 2. Effect of pericardial fluid on pBM-MSCs phenotype.
The phenotypic analysis was performed by multicolor flow cytometry. The cells were in vitro cultured for 7 days in the presence of Fetal Bovine Serum and in the presence of pericardial fluid at 25%, 50%, 75% and 100%. Representative histograms of four different experiments are shown (A). The expression level of Stem Cell Markers (CD29, CD31, CD44, CD90, CD105) and Swine Leukocyte Antigen Class-I and Class-II (SLA-I and SLA-II) is represented as Normalized Mean Relative Fluorescence Intensity which is calculated by dividing the Mean Fluorescent Intensity (MFI) by its isotype control. Graphic representation of mean±SD for each marker is also provided (n = 4) (B). No significant differences were found between groups when ANOVA test was performed.

