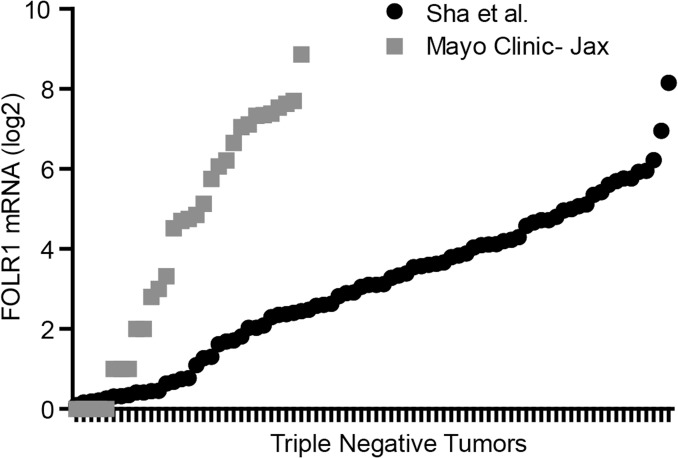
Fig 2. RNA-seq analysis of independent TNBC tumor datasets.
Distribution of FOLR1 gene counts (log2) from RNA-seq analysis of 31 TNBC tumors (Mayo Clinic) and 80 triple negative tumors from RNA-seq dataset of Shah et al. [31]. Of note, gene counts cannot be compared across the independent tumor datasets as data were generated differently (library protocols, sequencing depth, normalization etc.).

