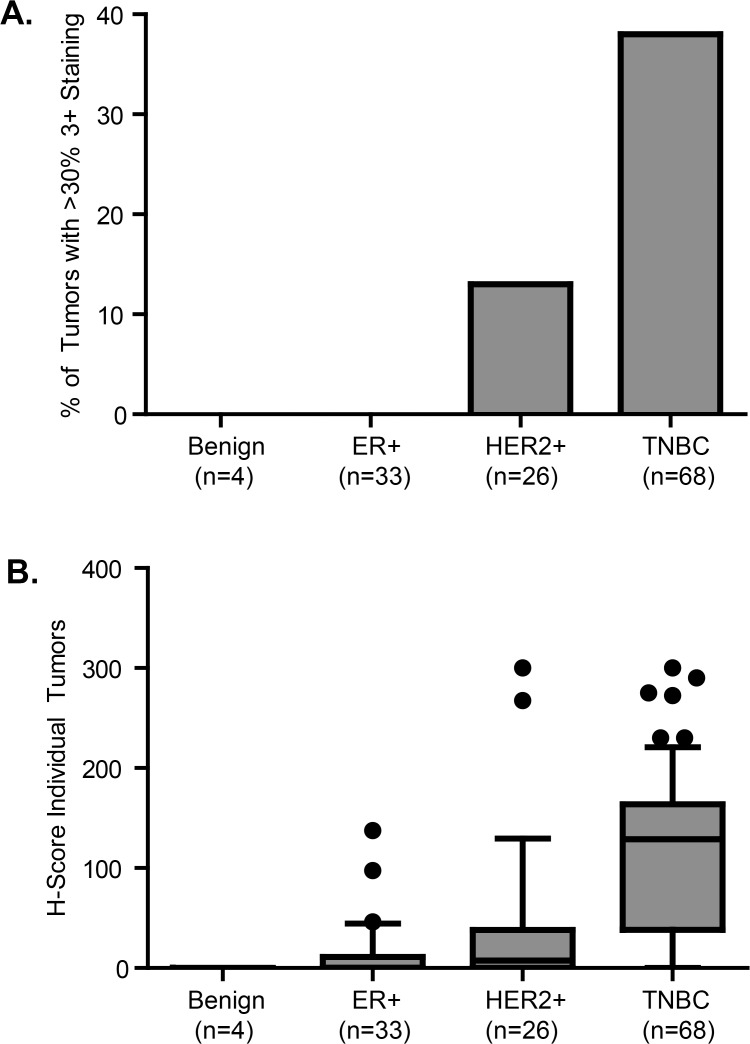
Fig 4. Analysis of FOLR1 immunohistochemical staining of breast cancer subtype tissue microarrays.
TMAs comprised of 131 breast cancer tumors of different subtypes from patients with classified breast cancers subtypes that include DCIS (n = 4), ER+ (n = 33), HER2+ (n = 26) and TNBC (n = 68). TMAs were evaluated using high affinity FOLR1 antibody Mab 26B3.F2 and IHC staining intensities calculated as described in the “Materials and Methods”. (A). The percentage of breast tumors with > 30% 3+ staining by subtype. P-values calculated Mann-Whitney test of TNBC versus benign, ER+ and HER2+. (B). H-score distribution of FOLR1 expression. H-scores were calculated with the formula: Hscore = 3 * (% at 3 +) + 2 * (% at 2 +) + 1 * (% at 1 +) + 0 * (% at 0). *Statistical significance determined by Mann-Whitney test of TNBC versus benign, ER+ and HER2+ for both (A) and (B).

