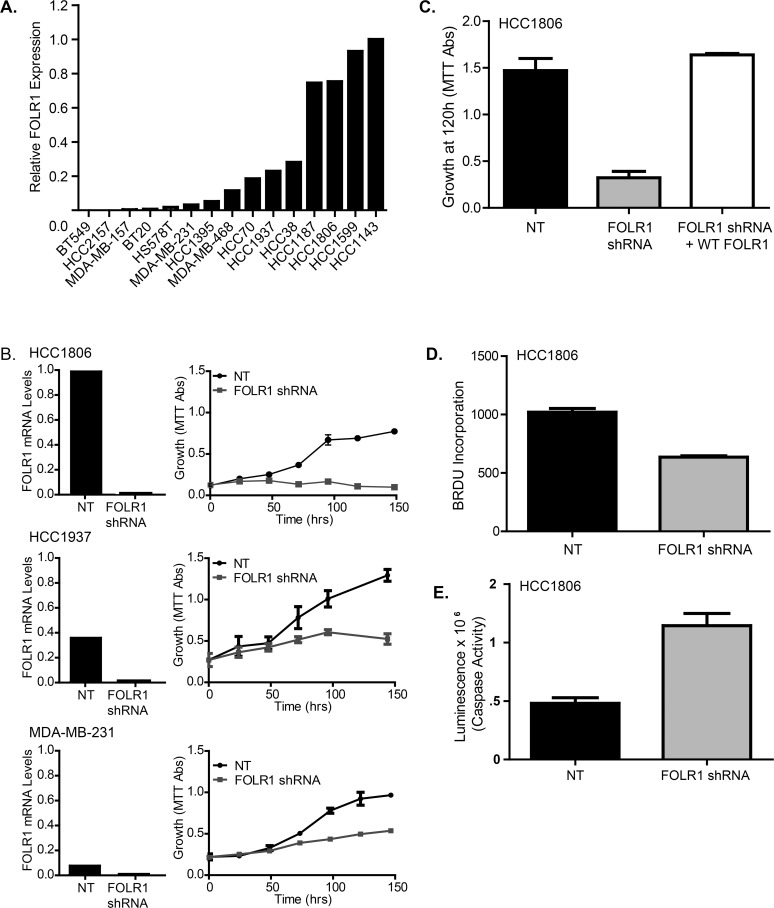
Fig 6. Expression of FOLR1 influences growth of TNBC breast cancer cell lines.
(A). FOLR1 mRNA abundance in 15 well-established TNBC cell lines as determined by qPCR. (B). FOLR1 expression was depleted by stable shRNA knockdown (KD) in a subset of established TNBC cell lines expressing high levels of FOLR1 mRNA. The relative level of FOLR1 KD was determined by quantitative PCR (left panel). The growth rates of FOLR1-depleted cells vs. control non-target cells were determined over 5 days using an MTT assay (right panel). Error bars represent ± SD. (C). Rescue of the growth phenotype in HCC1806 FOLR1 KD cells by forced overexpression of FOLR1. HCC1806 FOLR1 KD cells were infected with FOLR1 or NT retrovirus and selected for 7 days with 500ug/ml G418. Growth was measured by the MTT assay. Error bars represent ± SD. (D). BrdU incorporation in HCC1806 FOLR1 KD and NT cells after a 24 hr pulse. Data plotted as mean ± SD fluorescence represents relative BrdU incorporation. (E). Measurement of apoptosis in HCC1806 FOLR1 KD and NT cells using the luminescent Caspase-Glo 3/7 assay. Error bars represent ± SD.

