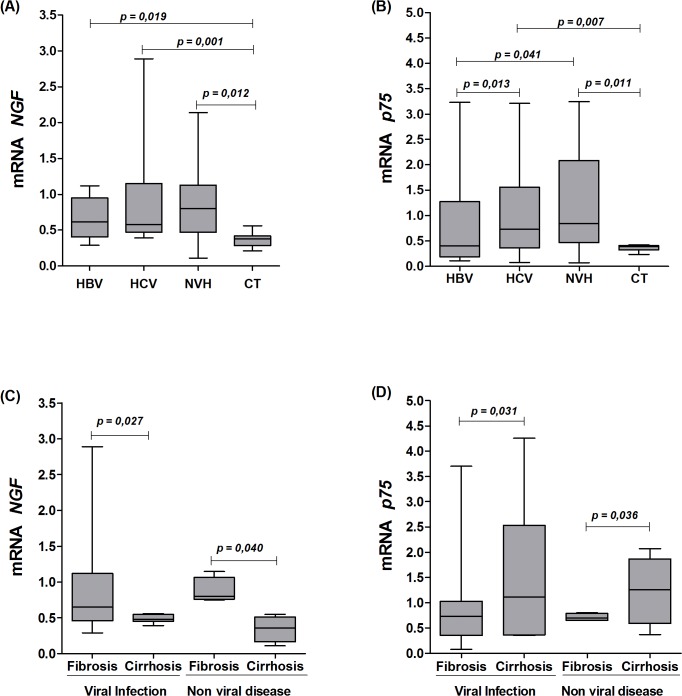
Fig 1. mRNA levels of NGF in the liver tissues.
A: mRNA levels of NGF in the liver tissues of subgroups with HBV, HCV and NVH and the Control group (CT). B: mRNA levels of p75NTR in the liver tissues of subgroups with HBV, HCV and NVH and the Control group (CT). C, D: mRNA levels of NGF and p75 NTR between the groups with hepatic fibrosis and cirrhosis due to viral and non-viral causes.

