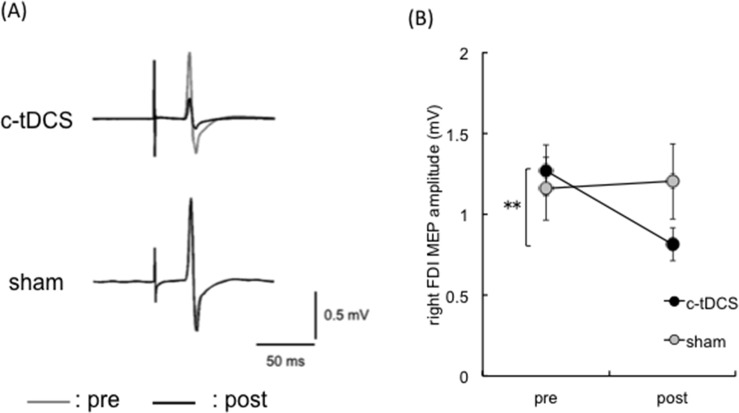
Fig 2. Manipulation check for cathodal transcranial direct current stimulation.
(A) MEP waveforms (each trace is an average of 16 trials) from right FDI of a representative participant. The gray and black traces indicate pre and post c-tDCS or sham sessions, respectively. (B) Mean right FDI MEP amplitude in the c-tDCS (closed circle) and sham (gray circle) sessions (n = 17). MEP amplitude decreased after c-tDCS and was unchanged in the sham session. Error bars indicate SE. * p< 0.05; ** p < 0.01.

